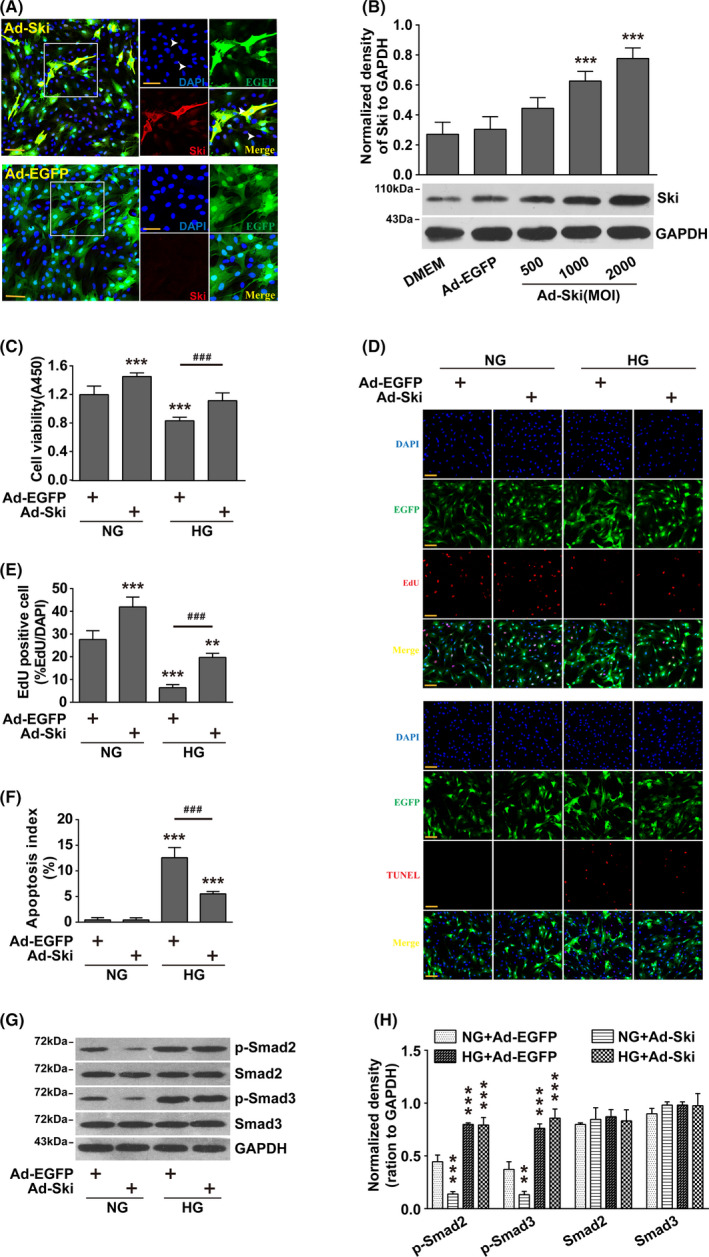
FIGURE 2.

Increasing Ski protein levels alleviated HG‐induced proliferation inhibition and apoptosis promotion in fibroblasts without affecting the level of Smad2/3 phosphorylation. Fibroblasts were infected with Ad‐Ski or Ad‐EGFP for 48 hour, combined with HG treatment for 48 hour. A, Immunofluorescence staining for Ski expression. Nuclei are indicated with DAPI staining (blue), and Ski expression is indicated by red fluorescence. The left panels show high‐magnification images of the boxed regions in the right panels. scale bar = 100 µm. B, Fibroblasts were infected with Ad‐Ski or Ad‐EGFP for 48 hour. The Ski levels were examined by Western blot analysis. The results were obtained from three independent experiments. *P < .05, **P < .01, ***P < .001 compared to the DMEM group, one‐way ANOVA, Dunnett's post hoc tests. C, CCK‐8 assay was used to evaluate fibroblast viability. n = 8,*P < .05, **P < .01, ***P < .001 compared to the NG + Ad‐EGFP group; #P < .05, ##P < .01, ###P < .001 compared to the HG + Ad‐EGFP group, one‐way ANOVA, Dunnett's post hoc tests. D, Fibroblast proliferation ability was assessed by an EdU assay, and fibroblast apoptosis was tested by a TUNEL assay, n = 8. Corresponding quantitative analyses are shown (E) and (F). EdU and TUNEL staining, red; nuclei, blue. *P < .05, **P < .01, ***P < .001 compared to the NG + Ad‐EGFP group; #P < .05, ##P < .01, ###P < .001 compared to the HG + Ad‐EGFP group, one‐way ANOVA, Dunnett's post hoc tests. scale bars = 100 µm. G‐H: Western blot analysis of p‐Smad2 and p‐Smad3 protein expression levels. The results were obtained from three independent experiments. *P < .05, **P < .01, ***P < .001 compared to corresponding NG + Ad‐EGFP group, one‐way ANOVA, Dunnett's post hoc tests
