FIGURE 1.

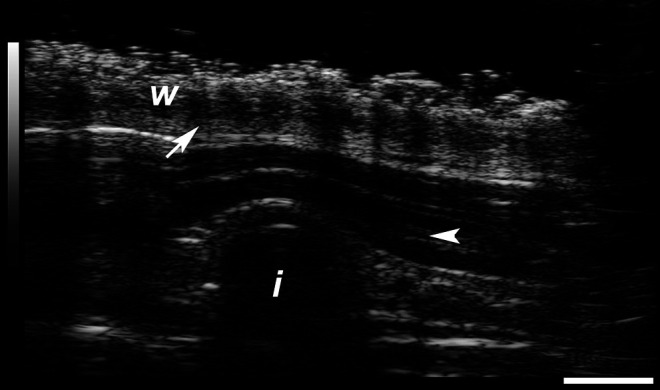
Ultrasound image recorded at 40 MHz showing tenofovir alafenamide implant (end-on view) in subcutaneous layer during sheep study (animal P564, Day 0). w, top wool layer; i, implant; arrow, epidermis; arrowhead, dermis. Scale bar, 2 mm.

Ultrasound image recorded at 40 MHz showing tenofovir alafenamide implant (end-on view) in subcutaneous layer during sheep study (animal P564, Day 0). w, top wool layer; i, implant; arrow, epidermis; arrowhead, dermis. Scale bar, 2 mm.