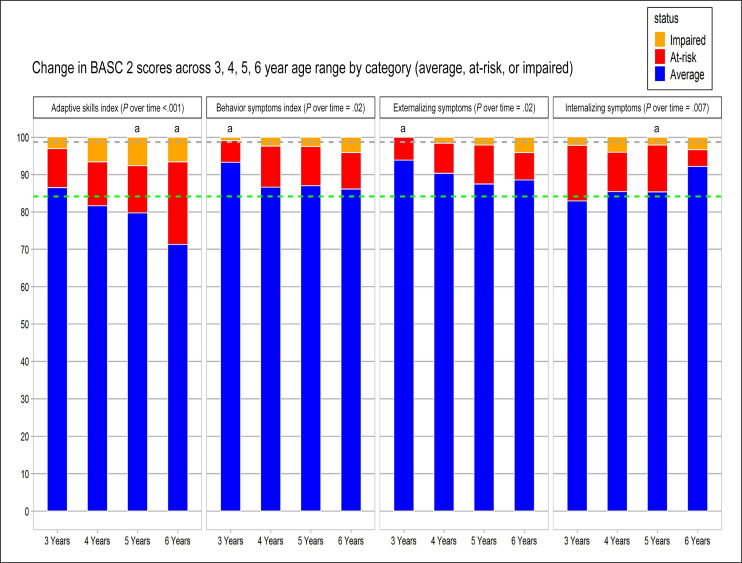
FIGURE 1.
Longitudinal BASC-2 scores. The distribution of average (blue), at-risk (red), and impaired (orange) scores in each of the composite indices of the BASC-2 at 3, 4, 5, and 6 years of age is shown. The green and gray dotted lines represent the anticipated distribution of average and impaired individuals on the basis of a normal distribution. aBased on normal distribution you would expect 84.134% average, 13.59% at risk, and 2.275% impaired.

