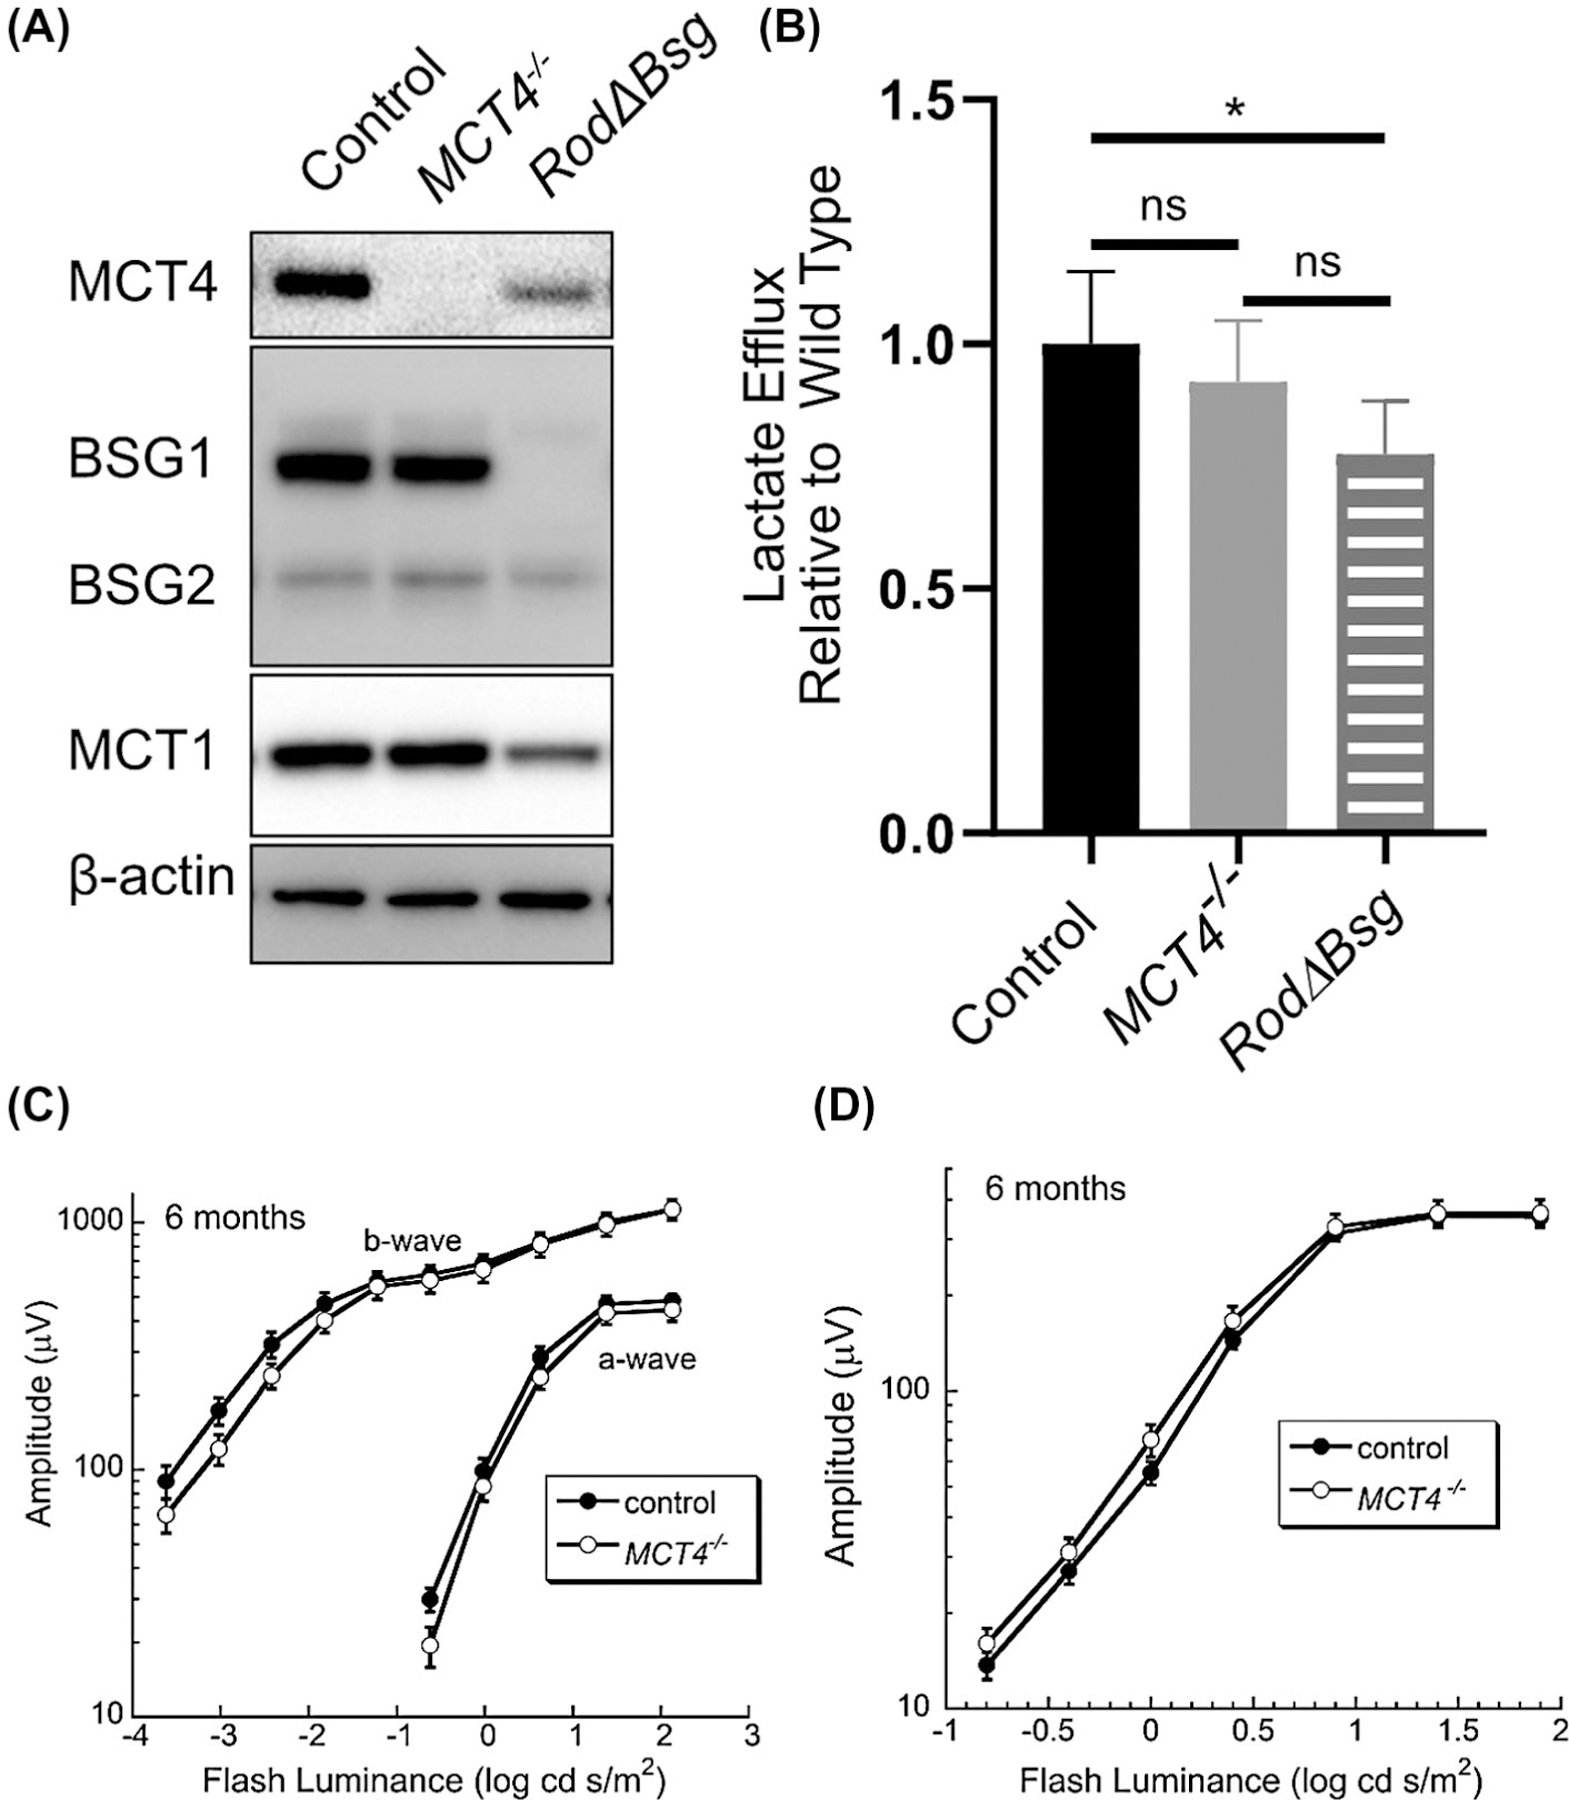
FIGURE 5.

Retinal phenotype of the MCT4−/− mouse A) Western blot analysis of control, MCT4−/−, and RodΔBsg retinas. Blots are representative of N = 3 mice. B) Lactate efflux from control (N = 6), MCT4−/− (N = 3), and RodΔBsg retinas (N = 3). Luminance-response functions for the major components of the C) dark-adapted and D) light-adapted ERGs obtained from control and MCT4−/− mice. Data points indicate average (±SEM) for 12 mice
