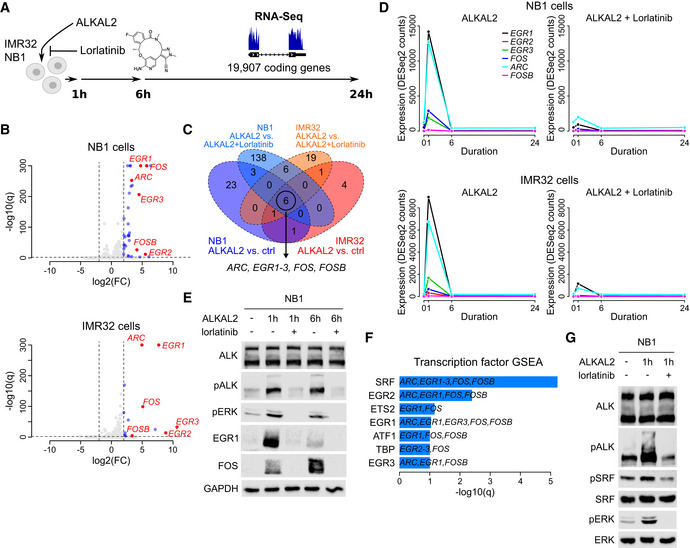
Figure 1. ALKAL2 stimulates ALK signalling and transcriptional responses in NB cells.

- RNA‐Seq‐based differential gene expression (DE) was measured in NB1 and IMR32 NB cell lines in response to ALKAL2 stimulation. See Table EV1 for detailed results.
- Volcano plot showing DE 1 h after NB1 (top) and IMR32 (bottom) cell treatment with ALKAL2. Dashed lines show DE thresholds. Up‐/downregulated genes indicated in blue. Six genes that are DE in both cell lines and sensitive to the ALK inhibitor lorlatinib are indicated and labelled in red.
- Venn diagram indicating the number of DE genes between different conditions as indicated. Outer circles (labels below diagram) indicate the number of DE genes after ALKAL2 addition for NB1 cells (34 genes) and IMR32 cells (13 genes). Inner circles (labels on top) correspond to the number of DE genes after addition of lorlatinib. Six genes that are DE in both cell lines and sensitive to lorlatinib are indicated.
- Temporal dynamics of ALKAL2‐induced transcription of ARC, EGR1‐3, FOS and FOSB in NB1 and IMR32 cells in the presence and absence of lorlatinib, as indicated.
- Immunoblot validation of ALKAL2 induction of EGR1 and FOS at the protein level in NB1 cells. Cells were treated for 0, 1 and 6 h in the presence and absence of lorlatinib as indicated.
- Transcription factor prediction based on a gene set enrichment analysis (GSEA) of the identified six‐gene set. Bar plot shows the log10(q) values of all enriched transcription factors at 10% FDR.
- Immunoblot analysis of ALKAL2 induction of pSRF in NB1 cells. Cells were treated for 0 and 1 h in the presence and absence of lorlatinib as indicated.
Data information: RNA‐Seq analysis was performed using three biological repeats. Immunoblots are representative of at least three independent experiments.
