
Figure EV3. Kaplan‐Meier relapse/event free survival probability curves for SRF.
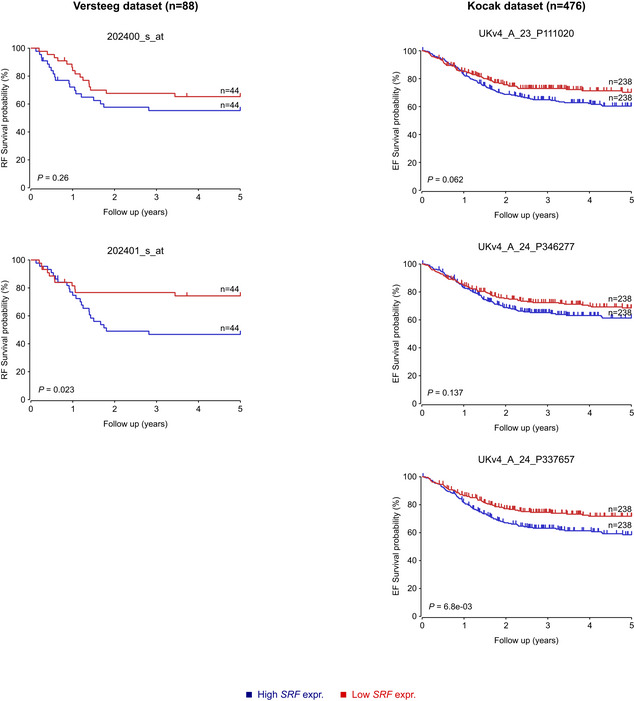
Kaplan‐Meier relapse/event free survival probability curves from the NB Versteeg cohort (left panels, 2 different probes) and the Kocak cohort (right panels, 3 different probes), as derived from the R2 platform. Patients with higher SRF expression are highlighted in blue, whereas patients with lower expression are highlighted in red. The log‐rank test P values are indicated.