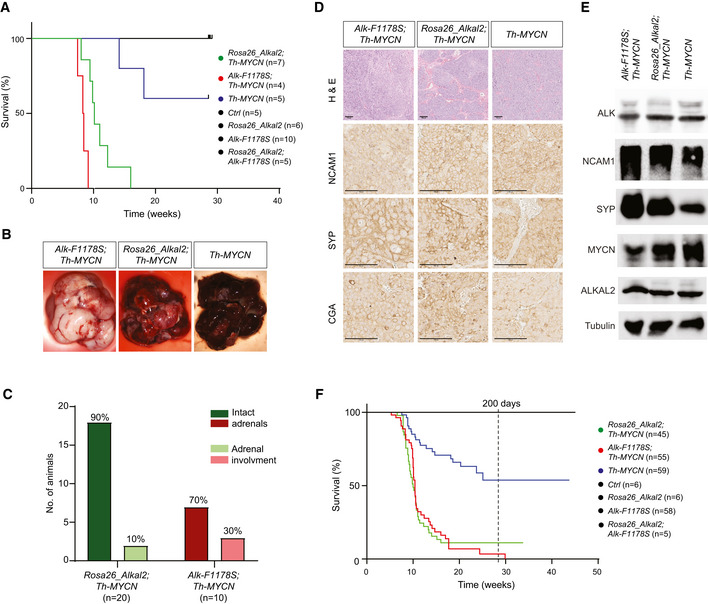
Figure 4. ALKAL2 collaborates with MYCN to drive NB in mouse models.

-
AThe oncogenic activity of MYCN is potentiated by overexpression of ALKAL2. Kaplan–Meier survival curves for Rosa26_Alkal2;Th‐MYCN, Alk‐F1178S;Th‐MYCN and Th‐MYCN mice. Also shown are Rosa26_Alkal2N, Alk‐F1178S and control (Ctrl) mice. Comparison of survival of Th‐MYCN alone and Rosa26_Alkal2;Th‐MYCN curves showed a significant difference (P = 0.003; log‐rank test).
-
B–ETumours harvested from Rosa26_Alkal2;Th‐MYCN, Alk‐F1178S;Th‐MYCN and Th‐MYCN mice express NB markers. Tumours from all three genotypes were large, in most cases filling the abdominal cavity (B). Dissection post‐mortem revealed that the majority of Rosa26_Alkal2;Th‐MYCN (18/20) and Alk‐F1178S;Th‐MYCN (7/10) tumours did not involve the adrenal glands (C). Histological examination of Rosa26_Alkal2;Th‐MYCN, Alk‐F1178S;Th‐MYCN and Th‐MYCN tumours revealed positive staining for NCAM1, synaptophysin (SYP) and Chromogranin A (CGA) (D) that was confirmed for NCAM1 and SYP along with MYCN, ALK and ALKAL2 by immunoblotting (E). Scale bars indicate 100 μm. Immunoblots are representative of three independent technical analyses.
-
FAccumulated Kaplan–Meier survival curves are shown for all monitored Rosa26_Alkal2;Th‐MYCN, Alk‐F1178S;Th‐MYCN and Th‐MYCN mice over time, estimating tumour penetrance (P < 0.001; log‐rank test).
