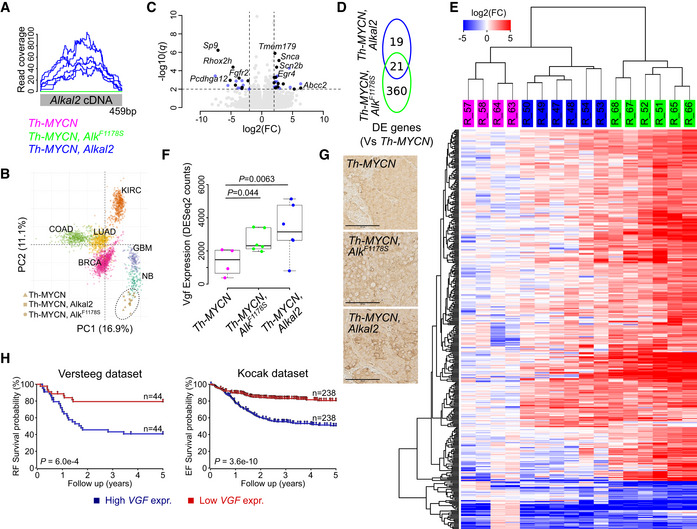
Figure 5. ALKAL2‐driven tumours share a transcriptional signature with ALK‐F1178S‐driven NB.

RNA‐Seq‐based differential gene expression analysis of tumours arising in Rosa26_Alkal2;Th‐MYCN (Alkal2) [n = 6], Alk‐F1178S;Th‐MYCN (AlkF1174S) [n = 6] and Th‐MYCN (MYCN) mice [n = 4]. See Table EV4 for detailed results.
-
ARead coverage of the codon‐optimized Alkal2 transgene, confirming Alkal2 expression in Alkal2 tumours.
-
BPrincipal component (PC) analysis of the expression signature of human neuroblastoma (NB) and five other human cancers (BRCA: breast adenocarcinoma; COAD: colon adenocarcinoma; LUAD: lung adenocarcinoma; KIRC: kidney renal clear cell carcinoma; GBM: glioblastoma multiforme) with mice tumour samples mapped independently using PC coordinates. MYCN amplified NB samples are indicated by circles, and non‐amplified samples are indicated by squares.
-
C, DVolcano plot showing differential expression (DE) between Alkal2 and MYCN tumours. Differentially expressed genes are shown in blue (DE in Alkal2 tumours only) or black (DE in both Alkal2 and AlkF1174S tumours, as shown in [D]). Top ranked genes labelled. Dashed lines represent DE cut‐offs.
-
EDE heatmap based on unsupervised hierarchical clustering of 400 DE genes (rows) and 16 samples (columns, as indicated on top). Sample colour legend as in (A). Colour key shown on top left.
-
FBoxplot showing Vgf expression in the three tumour types as indicated. Box plots indicate median values and lower/upper quartiles with whiskers extending to 1.5 times the interquartile range. P values calculated using Wald test as reported by DESeq2.
-
GHistological examination of Th‐MYCN, Rosa26_Alkal2;Th‐MYCN and Alk‐F1178S;Th‐MYCN tumours revealing positive staining for VGF. Scale bars indicate 100 μm.
-
HKaplan–Meier relapse‐free (RF) and event‐free (EF) survival probability curves from two different NB cohorts, the Versteeg 88 cohort (left panel) and the Kocak 649 cohort (right panel), as derived from the R2 platform. Patients with higher VGF expression are highlighted in blue, whereas patients with lower expression are highlighted in red. The log‐rank test P values are indicated.
