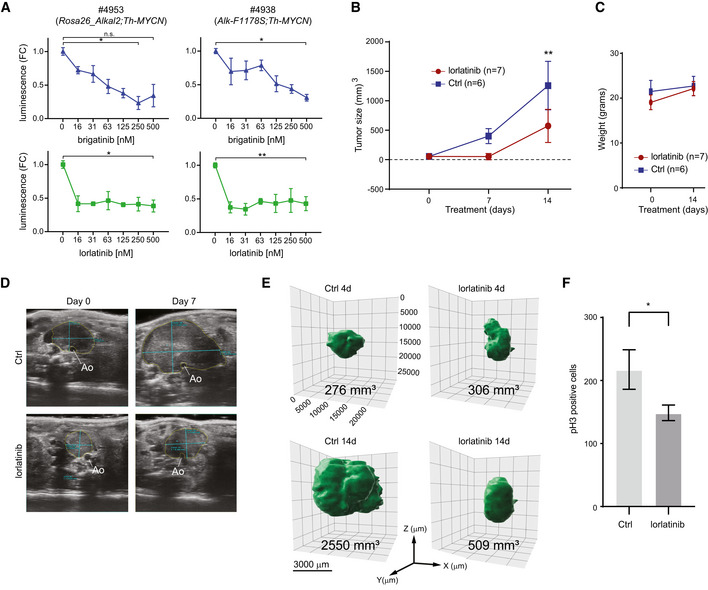
Cells derived from tumours arising in Rosa26_Alkal2;Th‐MYCN (#4953) and Alk‐F1178S;Th‐MYCN (#4938) mice are sensitive to both lorlatinib and brigatinib. The effect of increasing concentrations of each ALK TKI (as indicated) on cell confluence was analysed by IncuCyte Live Cell Analysis. Data are presented as mean ± SEM from three independent experiments. *P < 0.05, **P < 0.005; two‐tailed paired Student's t‐test.
Tumour volume changes over time for Rosa26_Alkal2;Th‐MYCN mice treated with lorlatinib (10 mg/kg; twice daily) or vehicle control. Tumour volume was measured by ultrasound on Days 0 and 7, and by direct measurement at Day 14. Day 0 (lorlatinib n = 7, Ctrl n = 6), Day 7 (lorlatinib n = 2, Ctrl n = 5) and Day 14 (lorlatinib n = 7, Ctrl n = 6). Data shown represent mean ± SD. **P < 0.005; two‐tailed unpaired Student's t‐test.
Rosa26_Alkal2;Th‐MYCN animals treated with lorlatinib did not display any significant loss of body weight compared with vehicle controls. Data shown represent mean ± SD.
Representative ultrasound images of tumours observed in Rosa26_Alkal2;Th‐MYCN mice with annotated measurements at Day 0 and Day 7. Tumours arise in the retroperitoneal space ventral to the aorta, Ao.
Representative MRI imaging of Rosa26_Alkal2;Th‐MYCN tumours in response to lorlatinib at 4 and 14 days.
Rosa26_Alkal2;Th‐MYCN tumours from lorlatinib or vehicle controls were analysed for phospho‐histone H3 (pH3). A representative field of view for each tumour at 40× (175.740 μm2) was manually counted. Data shown represent mean ± 95% CI. P = 0.0286; Mann–Whitney test.

