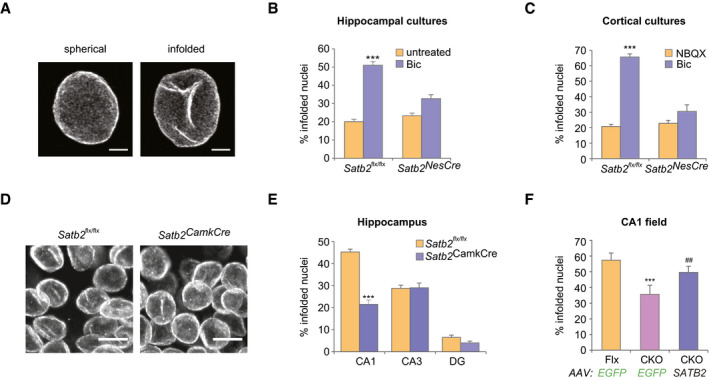
Figure 2. SATB2 determines nuclear envelope structural plasticity in neurons.

- Representative images of z‐axis projected stacks of confocal images of hippocampal neuronal nuclei immunostained for Lamin B2. Examples of spherical and infolded nuclei are shown. Scale bars: 3 μm.
- Activity‐induced formation of nuclear infoldings is abolished in SATB2‐deficient hippocampal neurons. Bic‐induced AP bursting for 1 h caused a significant increase in the percentage of infolded nuclei in DIV10 hippocampal cultures derived from Satb2flx/flx mice but not from Satb2flx/flx::Nes‐Cre mice (Satb2NesCre) (n = 6 independent primary cultures, two‐way ANOVA, F 1,20 = 9.51, significant interaction P = 0.0058, simple main effects analysis, Satb2flx/flx cultures, Bic‐treated vs untreated P = 0.0000043, Satb2NesCre cultures, Bic‐treated vs untreated P > 0.05, adjustment for multiple comparisons: Bonferroni, number of analyzed nuclei: Satb2flx/flx cultures, untreated—680, Satb2flx/flx cultures, Bic‐treated—711, Satb2NesCre, untreated—755, Satb2NesCre, Bic‐treated—720). Data are presented as mean ± SEM, ***P < 0.001.
- Activity‐induced formation of nuclear infoldings is impaired in SATB2‐deficient cortical neurons. DIV14 cortical cultures form Satb2flx/flx and Satb2NesCre mice were silenced with NBQX for 1 h followed by stimulation with Bic for 1 h. The percentage of infolded nuclei following AP bursting was increased in control Satb2flx/flx cultures but not in SATB2‐deficient cultures (n = 3–4 independent primary cultures, two‐way ANOVA, F 1,10 = 39.124, significant interaction P = 0.000094, simple main effects analysis, Satb2flx/flx cultures: Bic‐treated vs NBQX‐treated P = 7.66E‐07, Satb2NesCre cultures: Bic‐treated vs NBQX‐treated P > 0.05, adjustment for multiple comparisons: Bonferroni, number of analyzed nuclei: Satb2flx/flx cultures, NBQX—606, Satb2flx/flx cultures, Bic—910; Satb2NesCre cultures, NBQX—604, Satb2NesCre cultures, Bic—835). Data are presented as mean ± SEM, ***P < 0.001.
- Confocal images (z‐axis‐projected stacks) of Lamin B2 stained neuronal nuclei from the CA1 pyramidal cell layer of adult Satb2flx / flx and Satb2flx / flx::CamK2a‐Cre (Satb2CamkCre) mice. Scale bars: 10 μm.
- Analysis of the percentage of infolded nuclei in the hippocampus of Satb2flx/flx mice vs Satb2CamkCre mice. In Satb2flx/flx mice, the number of infolded nuclei was significantly higher in the CA1 area compared to the CA3 area (P = 0.000001) and DG (P = 1.8 E‐12). In Satb2CamkCre mice, the number of infolded nuclei in the CA1 area was significantly reduced compared to the corresponding number in littermate controls (P = 1.9 E‐09). No significant differences were observed in this number in the CA3 and DG between Satb2CamkCre mice and floxed controls (n = 4 mice, two‐way ANOVA, significant interaction, F 2,18 = 47.81, P = 0.00001, simple main effects analysis, CA1 area, Satb2flx / flx vs CKO mice P = 1.9 E‐09, CA3 area, Satb2flx / flx vs CKO mice P = 0.909, DG, Satb2flx / flx vs CKO mice P = 0.262, adjustment for multiple comparisons: Bonferroni). Number of analyzed nuclei: Satb2flx / flx mice: 469 (CA1), 225 (CA3), 665 (DG); Satb2CamkCre: 508 (CA1), 224 (CA3), 575 (DG). Data are presented as mean ± SEM, *** P < 0.001.
- Analysis of the percentage of infolded nuclei in the CA1 pyramidal cell layer of Satb2CamkCre mice vs littermate controls after stereotaxic injections of AAV‐SATB2‐V5 or AAV8‐EGFP. Viral delivery of SATB2 resulted in restoration of the number of infolded nuclei in the CA1 pyramidal cell layer of Satb2CamkCre mice (n = 3–5 mice, one‐way ANOVA followed by Hochberg post hoc test, F 2,9 = 33.1, Satb2CamkCre::AAV‐SATB2 vs Satb2flx / flx::AAV‐EGFP, P = 0.0012; Satb2flx / flx::AAV‐EGFP vs Satb2CamkCre::AAV‐EGFP, P = 0.00008, Satb2flx / flx::AAV‐EGFP vs Satb2CamkCre::AAV‐SATB2, P = 0.072). Number of analyzed nuclei: 388 (Satb2flx / flx::AAV‐EGFP), 560 (Satb2CamkCre::AAV‐EGFP), 546 (Satb2CamkCre::AAV‐SATB2). Data are presented as mean ± SEM, ***P < 0.001 compared to Satb2flx / flx::AAV‐EGFP, ## P < 0.01, compared to Satb2CamkCre::AAV‐EGFP.
Source data are available online for this figure.
