
Figure 4. LEMD2 and SATB2 regulate neuronal gene transcription in active neurons.
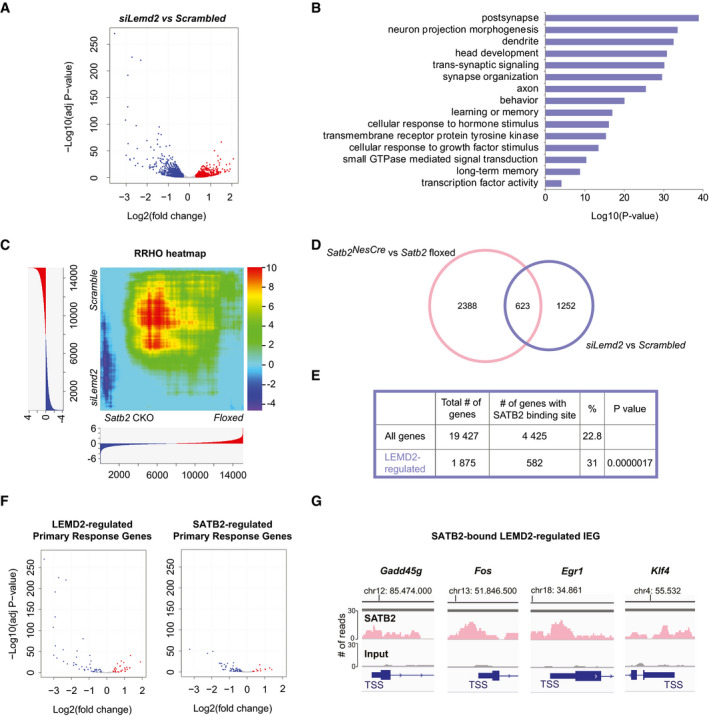
- Primary cortical Bic‐treated neurons transfected with either scrambled siRNA (Scrambled) or siRNA against Lemd2 (siLemd2) were subjected to RNA‐seq. “Volcano plot” of statistical significance against Log2 fold change between siLemd2‐ and scrambled siRNA‐transfected cultures. The differentially expressed genes are indicated in red (adjusted P‐value < 0.05, Log2fold change > 0.3) and blue (adjusted P‐value < 0.05, Log2fold change < −0.3), n = 3 independent primary cultures.
- GO enrichment analysis of the differentially expressed genes between siLemd2‐ and scrambled siRNA‐transfected cultures.
- Rank–rank hypergeometric overlap (RRHO) heatmap comparing the global gene expression signatures of Satb2 CamkCre vs floxed cortical cultures (n = 7) and siLemd2 vs scrambled siRNA‐transfected cultures (n = 3). For each dataset, all expressed genes (gene counts higher than 10) were ranked by their differential expression P‐values and effect size direction. The significance of the overlap between the two gene lists is plotted as −log10 transformed hypergeometric test P‐values corrected for multiple testing by Benjamini and Yekutieli method. The range of the P‐values is indicated in the color scale bar.
- Venn diagram illustrating the overlap between the differentially expressed genes in siLemd2‐ vs scrambled siRNA‐transfected Bic‐treated cortical cultures and Satb2 CamkCre vs Satb2 floxed primary Bic‐treated cortical cultures (Fisher’s exact test, P‐value < 10E‐16, OR = 3.159).
- Enrichment analysis for SATB2‐bound genes in the LEMD2‐regulated significant gene list (Fischer’s exact test, P‐value < 10E‐10, OR = 1.6).
- “Volcano plots” of statistical significance against Log2 fold change, depicting the PRGs (Tyssowski et al, 2018) that were differentially expressed in Bic‐treated siLemd2‐ vs scrambled siRNA‐transfected cultures (left panel) and Bic‐treated Satb2 CamkCre vs Satb2 floxed primary cortical cultures (right panel). The down‐regulated PRGs are indicated in blue (adjusted P‐value < 0.05, Log2fold change < −0.3), and the up‐regulated (adjusted P‐value < 0.05, Log2fold change > 0.3) are shown in red.
- Examples of IEGs with a SATB2 peak at their proximal promoter that were down‐regulated in both Bic‐treated Lemd2 knockdown and Satb2 knockout cultures.