
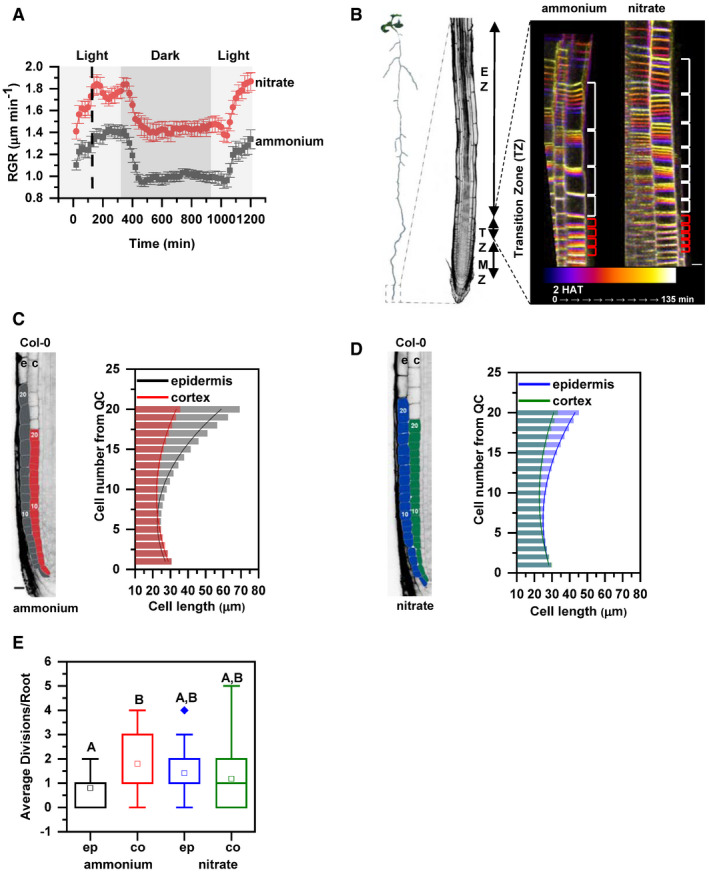
Figure 1. Primary root growth kinetics of Arabidopsis (Arabidopsis thaliana (L.) Heynh. Columbia‐0, Col‐0) on ammonium or nitrate‐containing medium.
-
ASeedlings were transferred 5 days after germination (DAG) to medium supplemented with ammonium (gray) or nitrate (red). Root growth rates (RGR in µm/min) were monitored over a 1,200 min period. Data represent the geometric mean (± standard error, SE) of 3 biological replicates, n = 5 (ammonium) and 6 (nitrate) roots. Light and dark periods are indicated as light or dark gray background, respectively.
-
BOn the left, schematic representation of distinct root zones: Meristematic Zone (MZ), Transition Zone (TZ) and Elongation Zone (EZ). On the right, time‐lapse imaging of cell growth at the TZ. Cells were visualized using the plasma membrane marker (wave line W131Y). Observation of roots started 2 h after transfer (2 HAT; blue) on ammonium or on nitrate for 135 min (white) and images were recorded every 20 min (9 stacks/root/recording). Red and white brackets indicate the length of meristematic and elongating cells at the last measurement point, respectively. Scale bar = 30 µm.
-
C, DRepresentation and quantification of cell length in epidermal (e) and cortical (c) cell files. Optical, longitudinal sections of 5 DAG old Col‐0 roots 12 HAT to ammonium (C) or nitrate (D) supplemented media. The first 20 epidermal (e) and cortex (c) cells (from quiescent center (QC)) are highlighted in gray and in red on ammonium (C), and in blue and green on nitrate (D), respectively. Scale bar = 30 µm. Column bars denote the geometric mean of the cell lengths at the respective positions. Lines represent a polynomial regression fit, with calculated slopes between cells 10 and 20 of 3.32639 ± 0.17172 (ammonium, epidermis), 1.22033 ± 0.08754 (ammonium, cortex) and 1.70502 ± 0.09532 (nitrate, epidermis), 0.82342 ± 0.06973 (nitrate, cortex). Data are derived from 3 biological replicates, n = 18 roots in each case.
-
EGraphical representation of the average number of cell divisions along epidermis (ep) and cortex (co) in 5 DAG root tips 12 HAT to ammonium or nitrate supplemented media. Data are derived from 15 and 17 roots. The statistical significance was evaluated with ANOVA at P < 0.05. The box chart components are defined as; box (25–75%), central band (median line), central box (mean), and the range are within 1.5IQR.
Source data are available online for this figure.