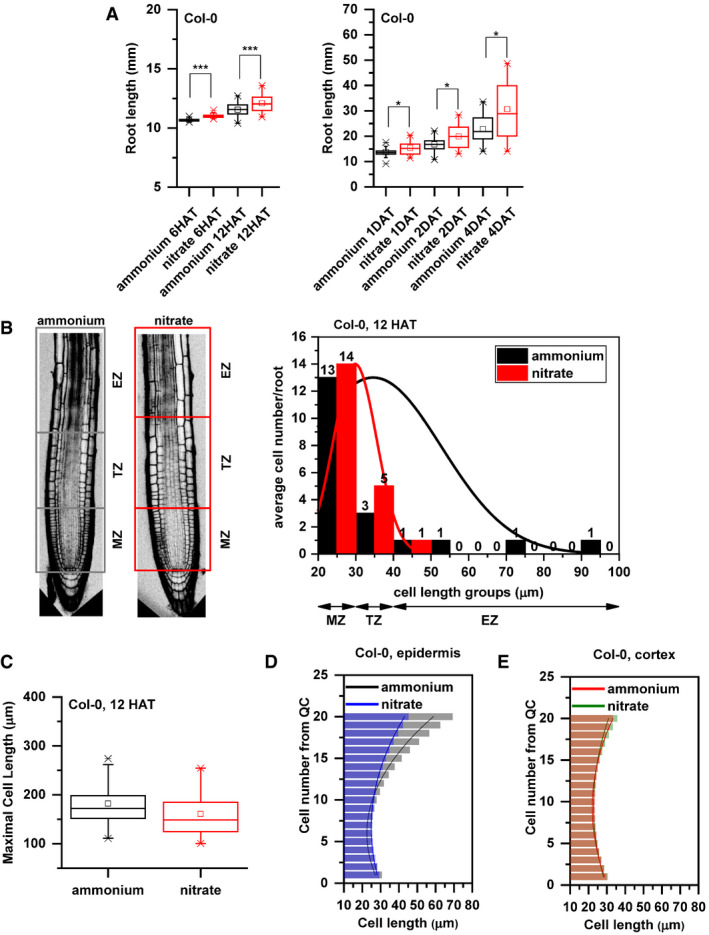
Figure EV1. Additional data supporting the distinct growth kinetics of Col‐0 roots transferred to ammonium or nitrate supplemented media.

-
APrimary root length (mm) of Col‐0 seedlings 6 and 12 HAT and 1, 2, and 4 days after transfer (DAT) to ammonium (black) or nitrate (red) supplemented medium. At least 34 roots were measured per time point per treatment. The statistical significance was evaluated with ANOVA at P < 0.05 (*) and P < 0.001 (***). The box chart components are defined as, box (25–75%), central band (median line), and central box (mean), and the range is within 1.5IQR.
-
BOn the left, schematic representation of distinct root zones: Meristematic Zone (MZ), Transition Zone (TZ, which is interpolated between the apical meristem and the subapical elongation zone), and Elongation Zone (EZ). Boxes highlight the borders of the specified root zones (gray box for ammonium and red for nitrate). On the right, Col‐0 epidermal cells length was measured along the root tip (from QC), grouped based on their cell length (x axis) and were plotted against the average cell number per group per root (y axis) in both conditions (ammonium, black and nitrate, red). Note the higher cell number in case of nitrate (red) in the group (30–40 µm, representing TZ). Data are derived from 3 biological replicates, and total number of analyzed roots is n = 18 in each case.
-
CMaximal cell length (measured at the end of the elongation zone) of Col‐0 roots 12 HAT either to ammonium (black) or nitrate (red). 13 roots per treatment, 3 cells per root were analyzed. The box chart components are defined as, box (25–75%), central band (median line), and central box (mean), and the range is within 1.5IQR.
-
D, EComparison of cell length measurements along epidermis (D) and cortex (E) upon ammonium (black and red) and nitrate (blue and green) treatments. Column bars denote the geometric mean of cell length at the respective positions. Lines represent a polynomial regression fit. Data are derived from 3 biological replicates, and total number of analyzed roots is n = 18 in each case.
Source data are available online for this figure.
