
Figure 4. PIN2 protein abundance, polarity, and vacuolar trafficking in roots on ammonium or nitrate‐containing medium.
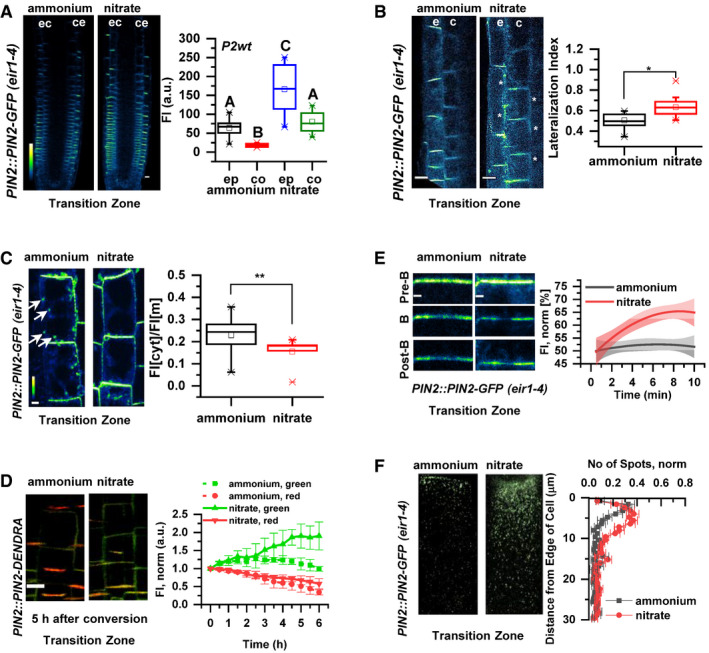
- Pseudo‐colored, optical longitudinal cross sections of 5 DAG roots expressing PIN2::PIN2‐GFP, eir1‐4 12 HAT to ammonium or nitrate supplemented media. “e” denotes epidermis and “c” cortex, respectively. Color code represents GFP intensity from low (blue) to high (white) values. Scale bar = 20 µm. Box plots display the distribution of the cell membrane‐derived PIN2‐GFP fluorescence intensity (FI) values (in arbitrary units, a.u.) on ammonium (gray, epidermis (ep) and red, cortex (co), n = 15) and nitrate (blue, epidermis (ep) and green, cortex (co), n = 10) grown roots. 5 cells per root were analyzed. The statistical significance was evaluated with ANOVA at P < 0.05. The box chart components are defined as, box (25–75%), central band (median line), and central box (mean), and the range is within 1.5IQR.
- Higher magnification of pseudo‐colored confocal images of 5 DAG old roots expressing PIN2‐GFP 12 HAT to ammonium or nitrate supplemented media. “e” denotes epidermis and “c” cortex, respectively. Color code represents GFP intensity from low (blue) to high (white) values. Scale bar = 12 µm. White stars mark PIN2‐GFP protein localization on the lateral membranes. Box plots display lateralization index (fluorescent signal detected on apical/basal membranes divided by the signal value at inner/outer membranes) of roots on ammonium (n = 31 cells from 6 roots) or nitrate (n = 24 cells from 6 roots) supplemented medium. The statistical significance was evaluated with ANOVA at P < 0.05. The box chart components are defined as, box (25–75%), central band (median line), and central box (mean), and the range is within 1.5IQR.
- Pseudo‐colored PIN2‐GFP signal in epidermal cells of 5 DAG old roots 12 HAT to ammonium or nitrate‐containing media. White arrows point to PIN2‐GFP containing intracellular vesicles. Box plots represent the ratio in fluorescent signal detected inside the cell vs. on the membranes (FI[cyt]/FI[m]). n = 6 roots per condition, 5 cells per root were analyzed. Scale bar = 5µm. The statistical significance was evaluated with ANOVA at P < 0.05. The box chart components are defined as, box (25–75%), central band (median line), and central box (mean), and the range is within 1.5IQR.
- Microscopic images showing PIN2‐Dendra fluorescent signal 5 h after photoconversion of PIN2‐Dendra into its red form. Depletion of the red signal and recovery of the green signal over a 6 h period was followed in parallel in 5 DAG old roots 12 HAT to ammonium or nitrate supplemented media. Note the increase in the intensity of the green signal in roots transferred to nitrate. Graph represents the mean signal ± SD (n = 6 roots per condition, 20 cells per root analyzed). The experiment was repeated 3 times. Scale bar = 20 µm.
- FRAP analysis of PIN2 protein mobility in PIN2::PIN2‐GFP expressing epidermal cells 12 HAT to ammonium or nitrate. The graph shows polynomial regression fit with 95% confidence band of the mean signal recovery in the bleached region of interest (ROI) after background subtraction and normalization to photobleaching. Data are derived from 3 biological replicates, each consisting of 5 membranes from 3 different roots. Scale bar = 2 µm.
- Representative 3D SIM microscopic images of 10 DAG old epidermal cells expressing PIN2‐GFP 12 HAT to ammonium or nitrate‐containing media. Green dots represent PIN2‐GFP on the lateral cell surface (polar domain) of epidermal cells in the transition zone. Graph represents the number of GFP‐positive spots along a 30 µm long region starting at the apical side of the cell (8 cells per 4 roots and 9 cells per 4 roots) were analyzed per treatment, experiment was done 3 times. Error bars represent mean + SE. Note the effect of ammonium vs. nitrate on the distribution of the PIN2‐GFP spots.
Source data are available online for this figure.