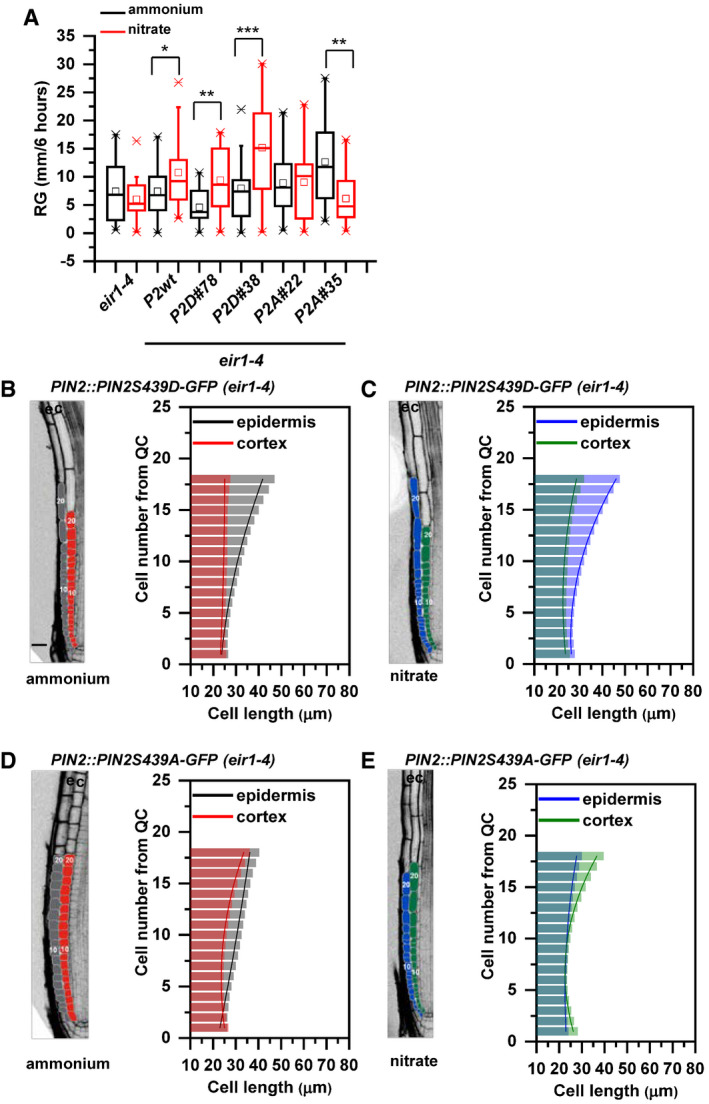
Figure EV4. Impact of PIN2S439 phospho‐variants on the adaptation of the primary root growth to ammonium or nitrate provision.

-
ABox plot representation of root growth (µm/6 h) of eir1‐4, Col‐0, PIN2::PIN2‐GFP (P2wt), two independent PIN2::PIN2S439D‐GFP (P2D) lines (#78 and #38) and two independent PIN2:PIN2S439A‐GFP (P2A) lines (#22 and #35) transferred to ammonium or nitrate‐containing medium. At least 10 roots were analyzed per genotype per treatment. The statistical significance was evaluated with ANOVA at P < 0.05 (*), P < 0.01 (**), P < 0.001 (***). The box chart components are defined as, box (25–75%), central band (median line), and central box (mean), and the range is within 1.5IQR.
-
B–EOptical, longitudinal sections of 5 DAG old roots expressing PIN2S439D‐GFP (B and C) and PIN2S439A‐GFP (D and E) 12 HAT to ammonium (B and D) or nitrate (C and D) supplemented media. The first 20‐20 epidermal and cortex cells (from quiescent center (QC)) are highlighted in gray and in red on ammonium (B and D) and in blue and green on nitrate (C and E), respectively. Scale bar = 30 µm. Column bars denote the geometric mean of cell length at the respective positions. Lines represent a polynomial regression fit, with calculated slopes between cells 10 and 20 of ammonium‐PIN2S439D‐epidermis: 1.38867 + 0.03079, ammonium‐PIN2S439D‐cortex: 0.05689 + 0.00497, nitrate‐PIN2S439D‐epidermis: 1.92749 + 0.0727, nitrate‐PIN2S439D‐cortex: 0.66477 + 0.03592, ammonium‐PIN2S439A‐epidermis: 0.7164 ± 0.00565, ammonium‐PIN2S439A‐cortex: 1.09064 ± 0.05609, nitrate‐PIN2S439A‐epidermis: 0.53796 ± 0.0249, and nitrate‐PIN2S439A‐cortex: 1.61118 ± 0.09541. Data are derived from 3 biological replicates; at least 5 roots were analyzed in each case.
Source data are available online for this figure.
