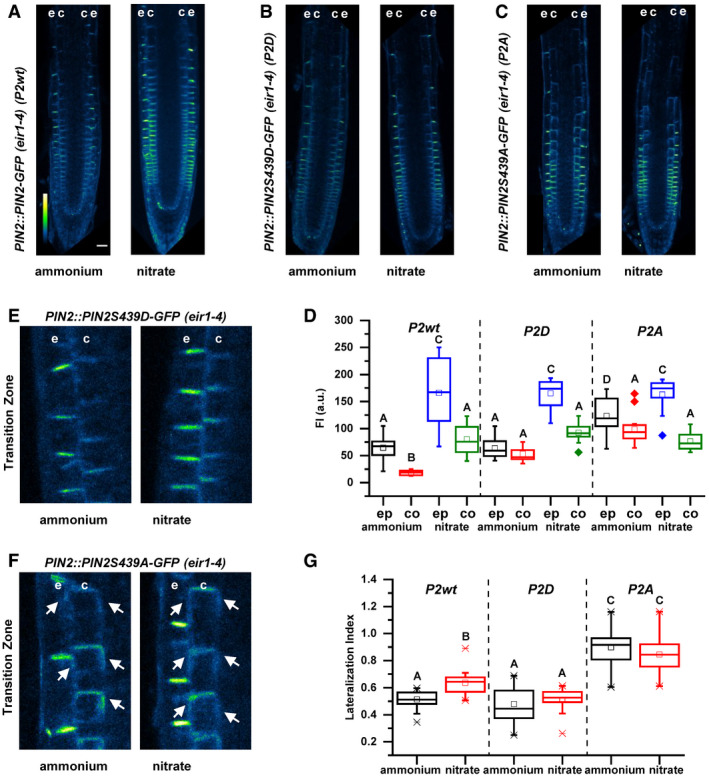
Figure 5. Impact of Ser439 on PIN2 localization in roots supplemented with ammonium or nitrate.

-
A–CPseudo‐colored, optical longitudinal cross sections of 5 DAG roots expressing (A) PIN2‐GFP (PIN2::PIN2‐GFP, P2wt) (B) PIN2S439D‐GFP (PIN2::PIN2S439D‐GFP, P2D) and (C) PIN2S439A (PIN2::PIN2S439A‐GFP, P2A)—all in eir1‐4 background – 12 HAT to ammonium or nitrate supplemented media. “e” denotes epidermis and “c” cortex, respectively. Color code represents GFP intensity from low (blue) to high (white) values. Scale bar = 50 µm.
-
DBox plots display the distribution of the cell membrane‐derived PIN2‐GFP fluorescence intensity (FI) values (in arbitrary units, a.u.) in roots transferred to ammonium ((gray, epidermis (ep) and red, cortex (co) and to nitrate (blue, epidermis (ep) and green, cortex (co)). 5 cells per roots were analyzed in at least 9 roots per genotype per treatment. The statistical significance was evaluated with ANOVA at P < 0.05. The box chart components are defined as, box (25–75%), central band (median line), and central box (mean), and the range is within 1.5IQR.
-
E, FMicroscopic images of 5 DAG old roots expressing (E) PIN2::PIN2S439D‐GFP and (F) PIN2::PIN2S439A‐GFP 12 HAT to ammonium or nitrate amended media. “e” denotes epidermis and “c” cortex, respectively. White arrows point to PIN2‐GFP protein localization on the lateral membranes.
-
GBox plots display lateralization index (fluorescent signal detected on apical/basal membranes vs. inner/outer membranes) of P2wt, P2D, and P2A roots transferred to ammonium (gray) or nitrate (red) supplemented medium. At least 24 cells from 5 roots were analyzed per genotype per treatment. The statistical significance was evaluated with ANOVA at P < 0.05. The box chart components are defined as, box (25–75%), central band (median line), and central box (mean), and the range is within 1.5IQR.
Source data are available online for this figure.
