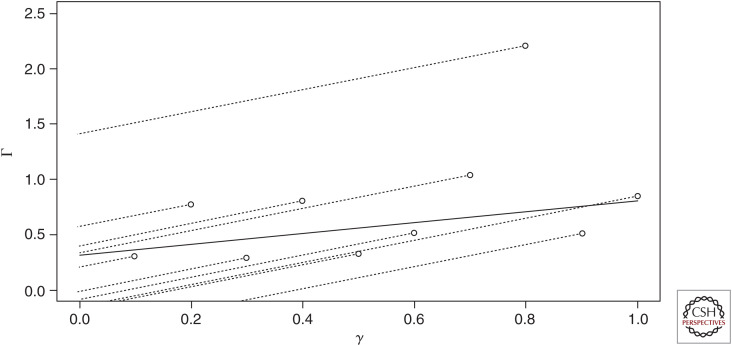
Figure 4.
MR-Egger estimator. γj and Γj are the same as in Figure 3, but each single-nucleotide polymorphism (SNP) now has a direct pleiotropic effect αj on Y such that Γj = αj + 1 × γj for all j. The solid line shows the MR-Egger fit, which is close to the true common causal effect. This shows that the observed heterogeneity in Figure 3 could arise from variable pleiotropy with a common causal effect, or from no pleiotropy with variable causal effects, or indeed from variation in both pleiotropy and causal effects. Polygenic MR methods resolve these scenarios by making different assumptions about pleiotropy.

