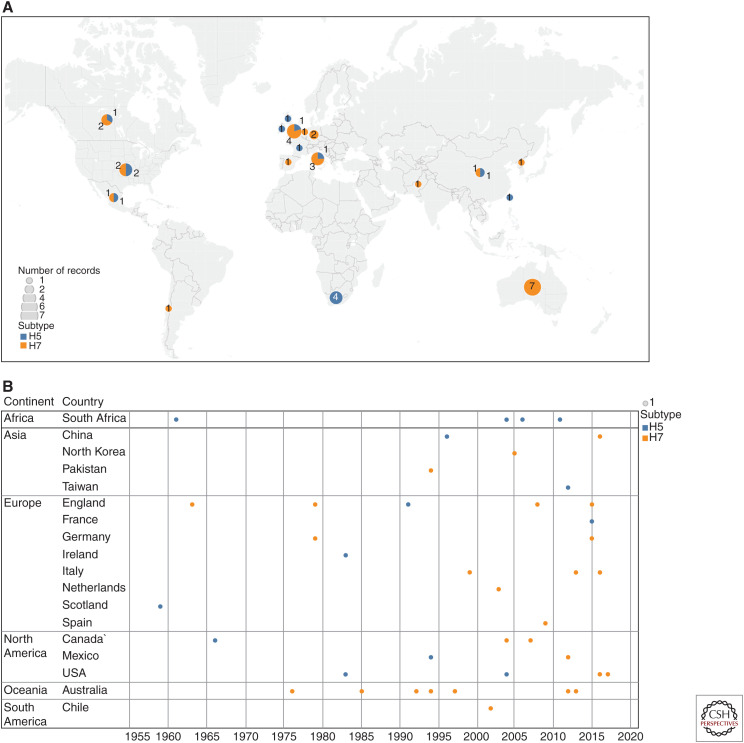
Figure 1.
Geographic origin of H5 and H7 high-pathogenicity avian influenza viruses by country from 1959 to 2019. (A) Map based on average of longitude and average of latitude. Color shows details about subtype. Size shows sum of number of records. The marks are labeled by sum of number of records. Details are shown for each country. (B) Year for each country broken down by continent. Color shows details about subtype. Size shows number of records.

