
Figure 2.
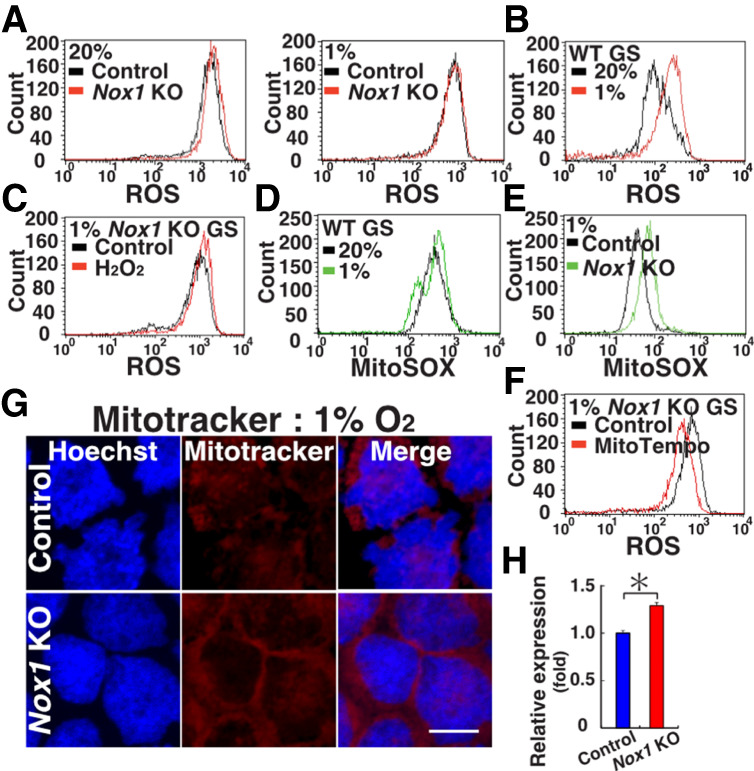
Oxygen-dependent changes in ROS levels. (A) Flow cytometric analysis of ROS levels in Nox1 KO GS cells under hypoxic and normoxic conditions by CellROX Deep Red. (B) Flow cytometric analysis of ROS levels in WT GS cells under hypoxic and normoxic conditions by CellROX Deep Red. (C) Flow cytometric analysis of ROS levels in Nox1 KO GS cells by CellROX Deep Red 2 d after H2O2 supplementation under hypoxia. (D,E) Flow cytometric analysis of mitochondria-derived ROS levels in WT (D) or Nox1 KO (E) GS cells using MitoSox. (F) Flow cytometric analysis of ROS levels in Nox1 KO GS cells by CellROX Deep Red 2 d after H2O2 treatment. (G,H) Mitotracker staining (G) and quantification (H) of its staining intensity in GS cells (n = 10). Scale bar in G, 20 µm. Stain in G is Hoechst 33342. Asterisk indicates statistical significance (P < 0.05).