
Figure 3.
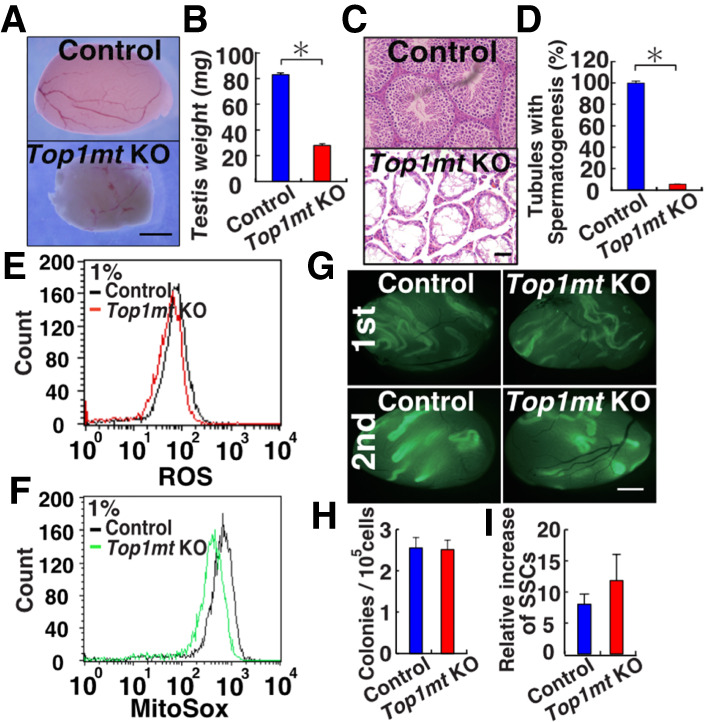
Functional analysis of SSCs in Top1mt KO mice. (A) Appearance of Top1mt KO mouse testis. (B) Testis weight (n = 6). (C) Histological appearance of Top1mt KO mouse testis. (D) Number of seminiferous tubules with spermatogenesis. At least 504 tubules were counted. (E,F) Flow cytometric analysis of ROS levels in Top1mt KO GS cells by CellROX Deep Red (E) and MitoSox (F). (G) Appearance of recipient testes. (H) Colony counts in primary recipients (n = 10). (I) Total increase in colony number (total regenerated colony number × 10)/(primary colony number used for serial transplantation) (n = 6). Scale bars: A,G, 1 mm; C, 50 µm. Stain in C is hematoxylin and eosin. Asterisk indicates statistical significance (P < 0.05).