
Figure 6.
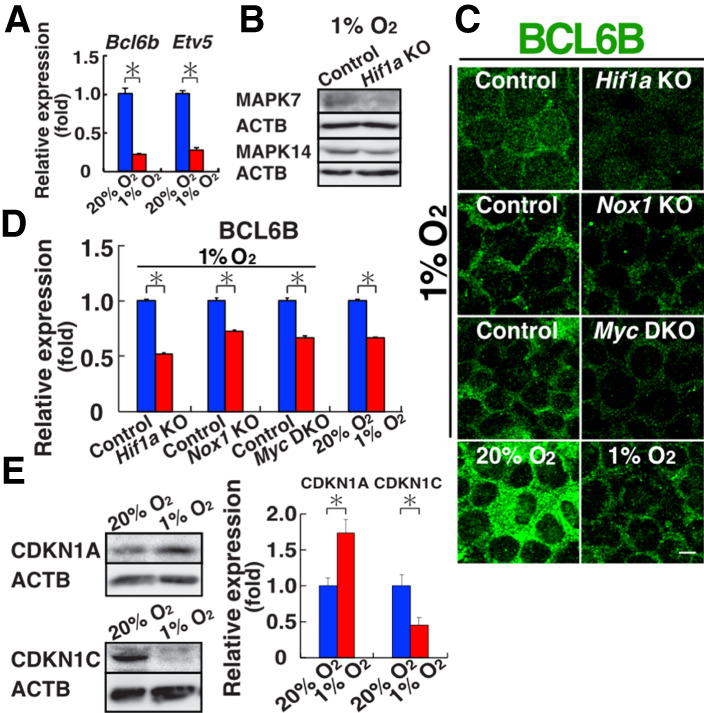
Lack of ROS amplification and increased CDKN1A expression under hypoxia. (A) Real-time PCR analysis of Etv5 and Bcl6b expression (n = 3). (B) Western blot analysis of MAPK7 and MAPK14 in WT GS cells (n = 3). (C,D) Immunostaining (C) and quantification (D) of BCL6B in WT, Hif1a, Nox1, and Myc DKO KO GS cells. Relative staining intensity in the nucleus was quantified (n = 10). (E) Western blot analysis of CDKN1A and CDKN1C in WT GS cells (n = 3). Scale bar in C, 10 µm. Stain in C is Hoechst 33342. Asterisk indicates statistical significance (P < 0.05).