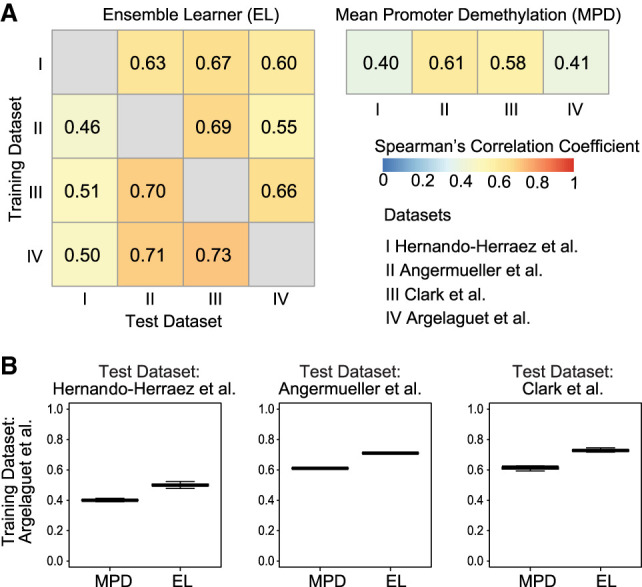
Figure 2.

Prediction accuracy of gene expression using DNA methylation data and ensemble learning. (A) Heatmap showing global Spearman's correlation coefficients between observed gene expression and predicted gene activity for all genes across all cells in a data set. Rows represent training data sets, and columns represent test data sets. Row and column Roman numerals correspond to the data sets shown. (B) Distribution of Spearman's correlation coefficients across genes using the data set of Clark et al. (2018) as the training set. Each data point represents one cell. MAPLE (EL) correlations are significantly higher than those of MPD (P < 10−16, one-sided t-test for all three comparisons).
