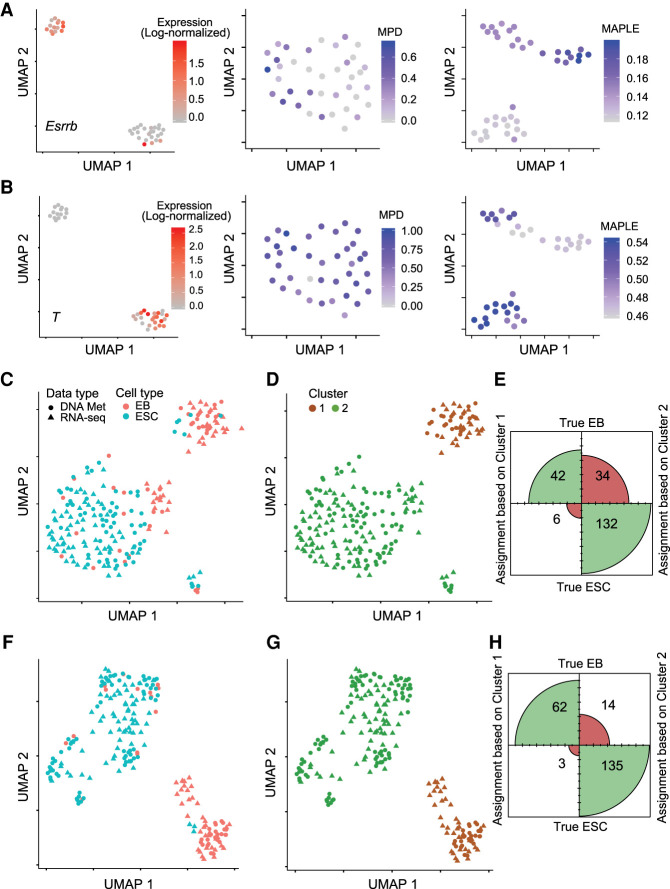
Figure 4.
Predictive modeling improves integration with transcriptome data of cell lines. (A) Cell heterogeneity based on transcriptome and DNA methylome data. (Left) UMAP using RNA-seq data as the input. Color scale represents the log-normalized (using Seurat) expression level (read counts) of Esrrb for EBs. (Middle) UMAP using mean promoter demethylation as the input. Color scale represents the MPD (1 − mean methylation level) level of the Esrrb gene. (Right) UMAP using MAPLE-predicted gene activity based on DNA methylation data as the input. Color scale represents the MAPLE-predicted gene activity levels of Esrrb. (B) Same as A, but for the T gene. (C) UMAP based on integrated RNA-seq and DNA methylation data. Mean promoter demethylation (MPD) was used as the input for data integration using Seurat. (EB) embryoid body; (ESC) embryonic stem cell. (D) Density clustering of the data shown in the UMAP in C. (E) Confusion matrix plot based on the clustering result shown in D, illustrating the agreement between cell type assignment based on clustering and true cell type. Size of each quadrant is proportional to the number of cells classified. (F) Same as C, but using predicted gene activity as the input. (G) Same as D, but using predicted gene activity as the input. (H) Same as E, but using predicted gene activity as the input. χ2 test P-value for the confusion matrices in G and H is 0.002.

