Figure 5.
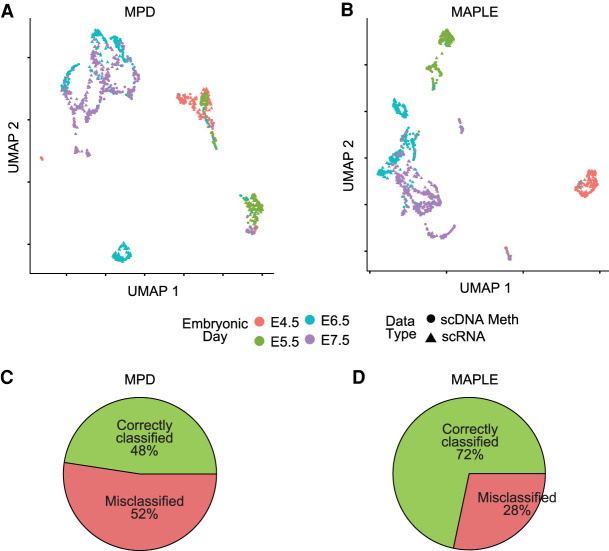
Predictive modeling improves integration with transcriptome data of primary tissues. (A) UMAP plots for integrated expression and DNA methylation data. Mean promoter demethylation (MPD) was used as the input for data integration using Seurat. (B) Same as A, but using MAPLE-predicted gene activity as the input. (C) Pie chart showing the percentage of correctly and misclassified cells using scDNA-methylation data, based on k-nearest neighbor (k-NN) classification on the scRNA-seq cells for the MPD-based UMAP in A. (D) Same as C, but for the MAPLE-based UMAP in B. χ2 test P-value for the comparison between correct and misclassifications in C and D is 3.6 × 10⁻¹⁰.

