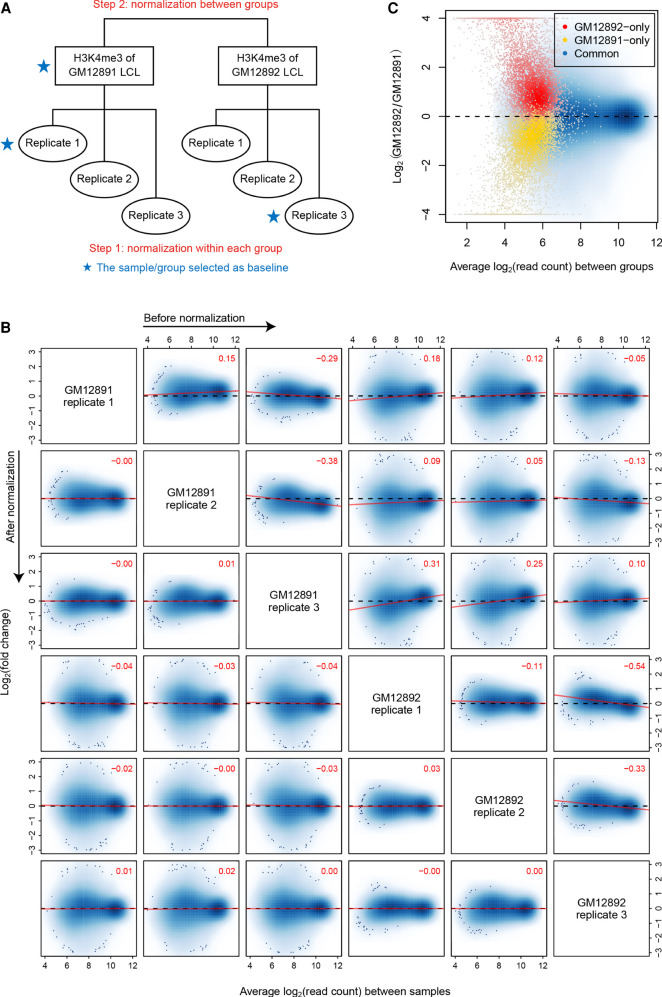
Figure 1.
Hierarchical normalization for groups of ChIP-seq samples. (A) Diagram illustrating the hierarchical normalization process applied to the H3K4me3 ChIP-seq samples of GM12891 and GM12892 LCLs. (B) MA scatterplots for each pair of H3K4me3 samples before and after normalization. Only common peak regions of the associated two samples are used to draw each plot, in which the top-right numeric value gives the Pearson correlation coefficient (PCC) between M and A values across these regions. Red lines are fitted by the least squares method. (C) MA scatterplot for normalized reference profiles of GM12891 and GM12892. Here, genomic intervals are classified based on their occupancy states in the two reference profiles.

