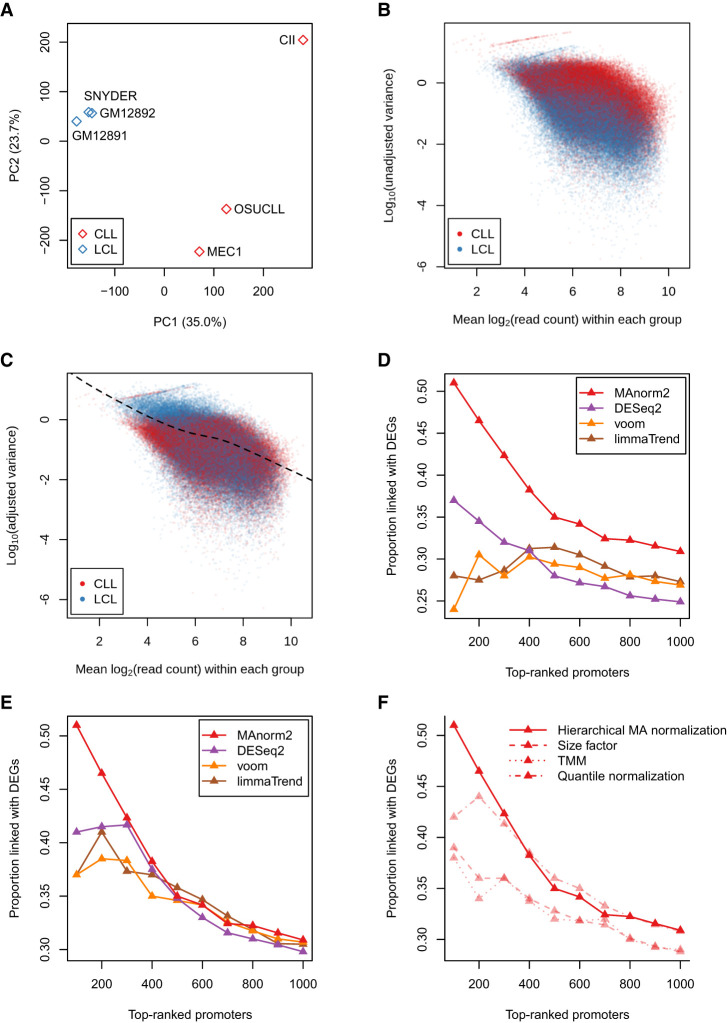
Figure 4.
Explicitly modeling the difference in global within-group variability between groups. (A) PCA results on normalized H3K27ac ChIP-seq signal intensities of three LCLs and three CLL cell lines. (B) Scatterplot of log10 observed variances against observed mean signal intensities from different groups of samples. (C) Scatterplot of log10 adjusted variances against observed mean signal intensities. (D) Comparing the performance of MAnorm2 with limma-trend, voom, and DESeq2 in the differential analysis of H3K27ac ChIP-seq data between LCLs and CLL cell lines. (E) Comparing the four methods with unifying their normalization methods to hierarchical MA normalization. (F) Comparing the performance of MAnorm2 across different normalization methods.

