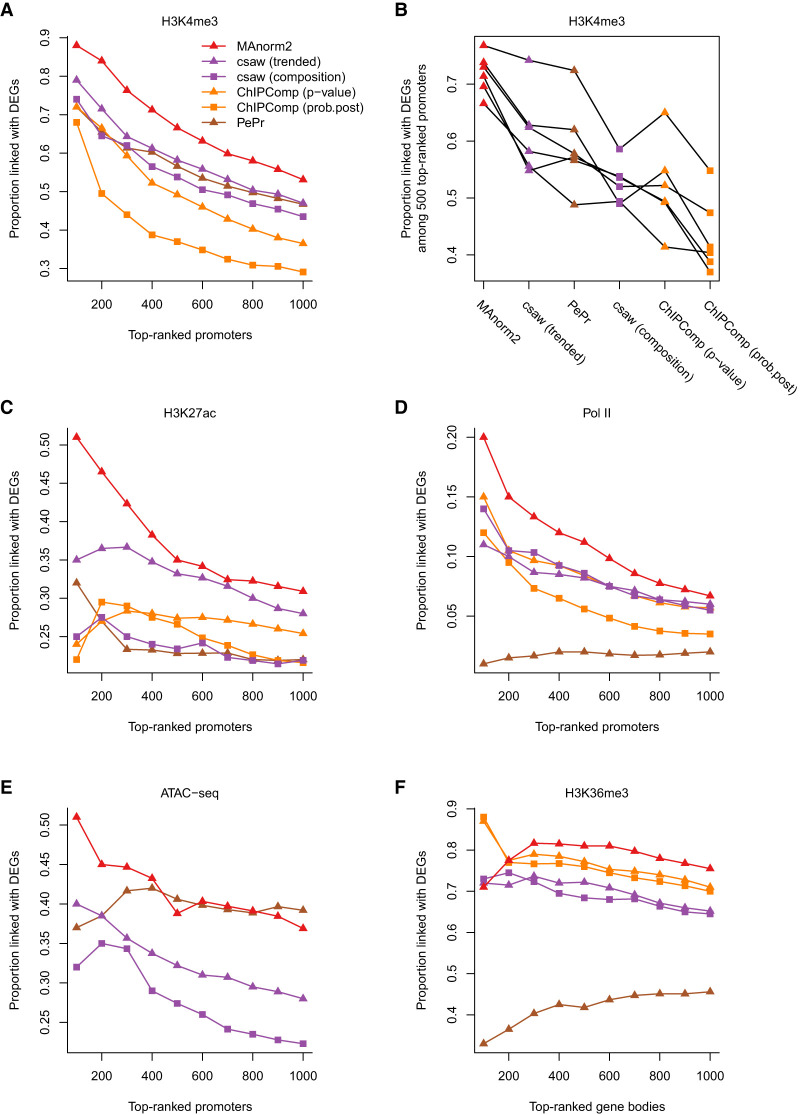
Figure 6.
Comparing MAnorm2 with other tools for group-level differential ChIP-seq analysis. (A) Differential analysis of H3K4me3 ChIP-seq data between GM12891 and GM12892. (B) Pairwise comparisons of H3K4me3 levels among GM12890, GM12891, GM12892, and SNYDER. Methods are sorted by the average true discovery proportion (among 500 top-ranked promoter intervals) across all the comparisons. (C) Differential analysis of H3K27ac ChIP-seq data between LCLs and CLL cell lines. (D) Differential analysis of Pol II ChIP-seq data between Japanese and non-Japanese LUAD cell lines. (E) Differential ATAC-seq analysis between LUAD and LUSC patients. ChIPComp is not applicable in this analysis as it requires input samples to model background noise. (F) Differential analysis of H3K36me3 ChIP-seq data between H1 and GM12891.

