Figure 7.
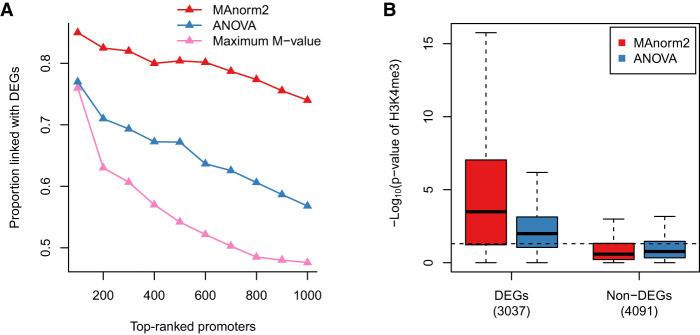
Simultaneously comparing multiple groups of ChIP-seq samples. (A) In the simultaneous comparison of H3K4me3 levels among GM12890, GM12891, GM12892, and SNYDER, the proportion of true discoveries among top-ranked promoter intervals is plotted against the number of top-ranked promoter intervals. DEGs were identified by applying the likelihood ratio test provided by DESeq2 to the corresponding four groups of RNA-seq samples, with a P-value cutoff of 0.01. (B) Box plots for the −log10 P-values assigned to promoter regions of DEGs and non-DEGs. Dotted line corresponds to a P-value of 0.05. Non-DEGs were defined as the genes with a DESeq2 P-value larger than 0.5 and a maximum fold change among the four groups less than 2.

