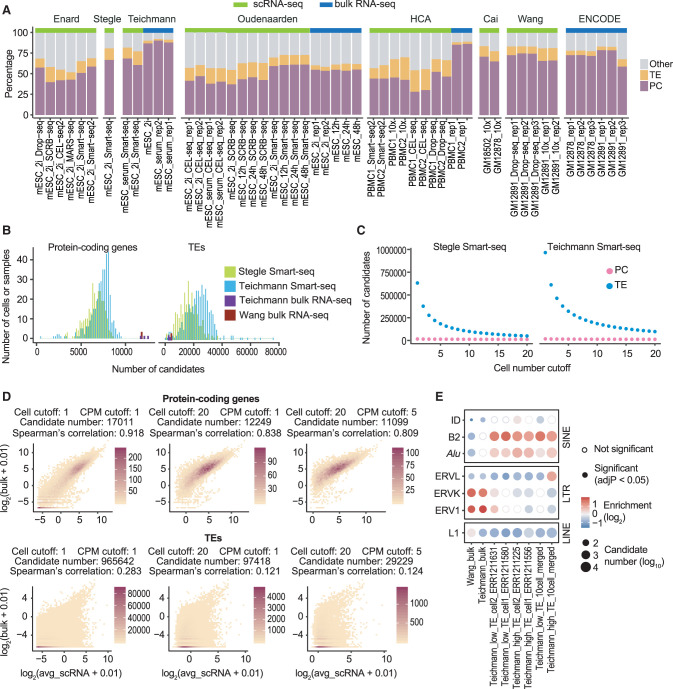
Figure 1.
Counting scRNA-seq signal at individual TEs results in large numbers of false positive candidates. (A) Distribution of mappable reads in 16 bulk RNA-seq and 36 scRNA-seq data sets. Compared to bulk RNA-seq, scRNA-seq data have a higher percentage of reads mapped to TEs. Samples were arranged by studies. Data sets used in this figure are summarized in Supplemental Table S1. (PC) Protein-coding exons defined by RefSeq; (TE) transposable elements that do not overlap with protein-coding exons; (Other) other genomic locations; (mESC) mouse embryonic stem cell; (PBMC) human peripheral blood mononuclear cell; (GM12878 and GM12891) human lymphoblastoid cell lines. (B) Number of expressed (counts per million, CPM ≥ 1) protein-coding genes and TEs in mESC bulk RNA-seq and Smart-seq samples. On average, 12,000 protein-coding genes and 6000 TEs were detected in each bulk RNA-seq sample. In contrast, scRNA-seq captured 7000 protein-coding genes and 20,000 TEs per cell. (C) Number of candidates as a function of cell number cutoff. (Cell number cutoff) Minimum number of cells each candidate is expressed in; (expression cutoff) CPM ≥ 1. A cell number cutoff of 10 requires a candidate to have at least 1 CPM in at least 10 cells. Although the majority of protein-coding gene candidates were consistently detected in mESC Smart-seq data, a large number of TE candidates were detected in fewer than 10 cells. (D) Correlation between bulk RNA-seq and averaged scRNA-seq signal at protein-coding genes and TEs (Teichmann laboratory, mESC). Low correlation between bulk RNA-seq and averaged Smart-seq signal was observed at TEs regardless of expression cutoff. (Cell cutoff) Minimum number of cells each candidate is expressed in; (CPM cutoff) minimum CPM value for one candidate to be considered as expressed. Color scale represents the number of candidates. (E) TE-family enrichment analysis using TE candidates identified from mESC bulk RNA-seq and Smart-seq. Enrichment of ERV elements was observed with bulk RNA-seq data, but not in single cells. Smart-seq data of four single cells with different percentage of TE reads and merged Smart-seq data from 10 cells were included.

