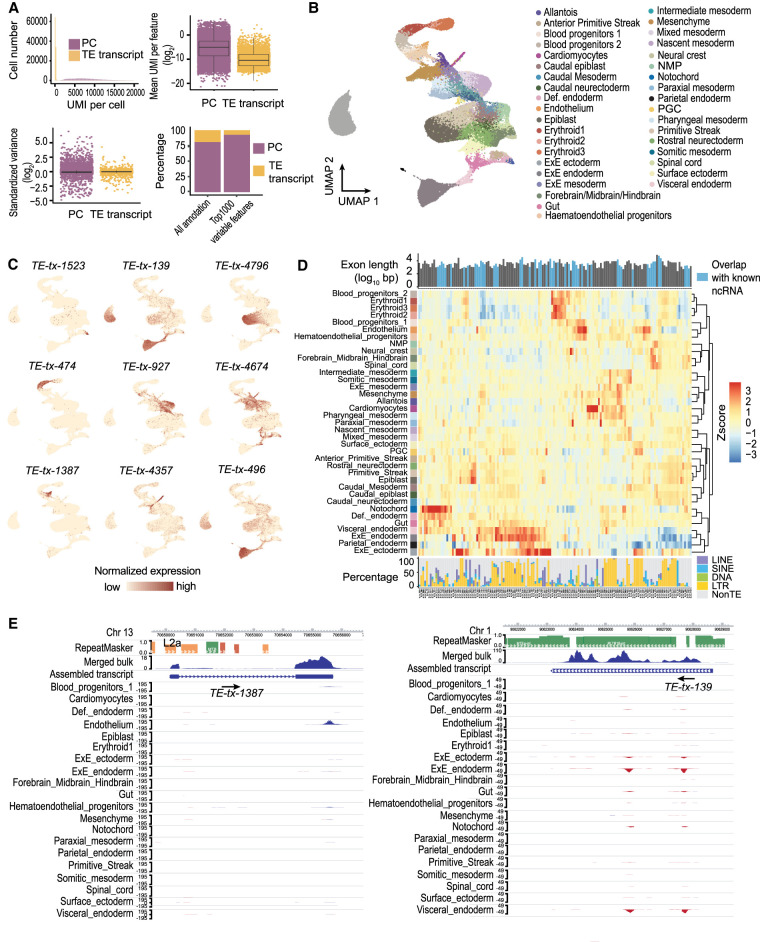
Figure 4.
Tissue-specific TE expression during mouse gastrulation and early organogenesis. (A, upper left) Fewer unique molecular identifiers (UMIs) were mapped to TE transcripts than to protein-coding genes. (Upper right) The averaged expression level of TE transcripts across all the cells was lower compared to protein-coding genes. (Lower left) TE transcripts lack the extreme standardized variance observed at protein-coding genes. (Lower right) TE transcripts account for 73 of the top 1000 variable features. (B) UMAP of scRNA-seq data. Cells were colored based on tissue information provided by the original study. (C) Examples of tissue-specific TE transcripts. (D) Normalized expression pattern (center, heatmap) of 146 TE transcripts (columns) across 37 tissues (rows). Transcript length, annotation status (top, bar plot), and TE composition (bottom, bar plot) were shown for each TE transcript. (E) Genome browser view of two TE transcripts with strong tissue enrichment. Assembled TE transcripts, uniquely mapped reads of merged bulk RNA-seq (from 37 samples that were used for transcript assembly), and scRNA-seq signal for selected tissues were shown. (Left) A TE transcript that is initiated from an L2a element, the second exon of this transcript is composed of non-TE sequences. (Right) A TE transcript that is almost exclusively composed of ERV sequences.

