Figure 1.
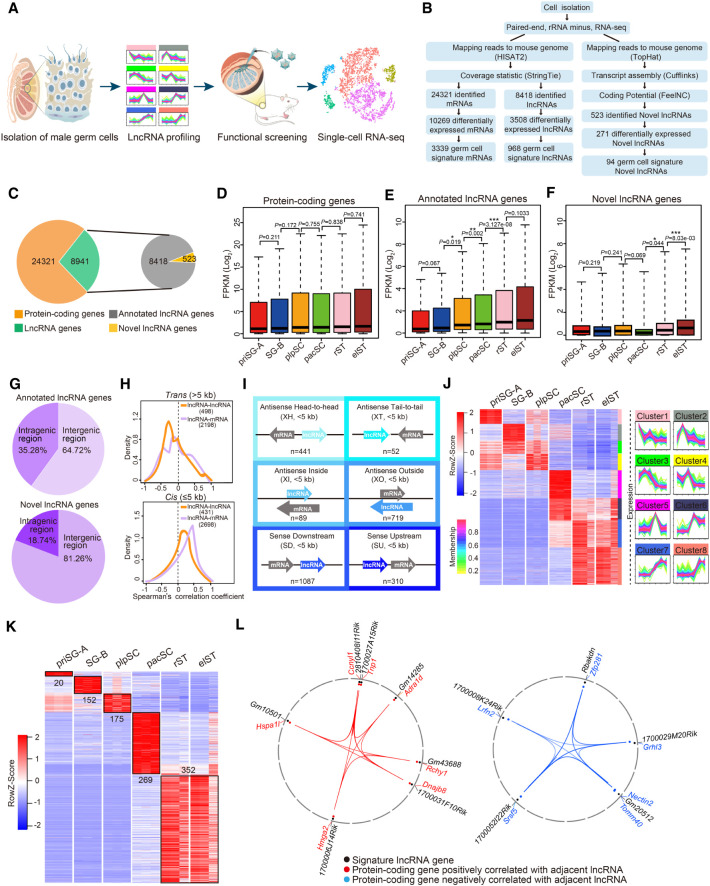
Global lncRNA expression dynamics during mouse spermatogenesis. (A) Schematic workflow of dissecting lncRNA dynamics and identifying functional lncRNAs during mouse spermatogenesis. (B) Pipeline for transcriptome analysis of six distinct germ cell types. (C) The number of protein-coding and lncRNA genes expressed during spermatogenesis (left) and the proportion of lncRNA genes that were annotated versus novel (right). (D–F) Box plots showing differential expression characteristics of protein-coding (D), annotated (E), and novel (F) lncRNA genes in each germ cell type: priSG-A, SG-B, plpSC, pacSC, rST, and elST. P-values were calculated using Student's t-test. (*) P < 0.05, (**) P < 0.01, (***) P < 0.001. (G) Percentage of intergenic and intragenic lncRNA genes. (Top) Annotated lncRNA genes; (bottom) novel lncRNA genes. (H) Correlation of lncRNAs with neighboring genes in trans (top: pairwise with a distance >5 kb) or in cis (bottom: pairwise with a distance ≤5 kb). (I) Six locus biotypes of lncRNAs according to their genomic locations relative to the neighboring protein-coding genes: antisense lncRNA/mRNA gene pairs in the head-to-head position were designated divergent (XH); antisense lncRNA/mRNA gene pairs in the tail-to-tail position were designated convergent (XT); the gene body of an antisense lncRNA can be located within a protein-coding gene (XI) or can completely encompass a protein-coding gene (XO); the lncRNAs transcribed in the same direction can be located downstream (SD) or upstream (SU) of the neighboring coding genes. (J) Heat map showing dynamic expression pattern of lncRNAs using WGCNA (left) and STEM (right). (K) Heat map displaying relative expression level of germ cell developmental signature lncRNAs during spermatogenesis. (L) The positive correlation (left) and negative correlation (right) of germ cell signature lncRNAs with their neighboring protein-coding genes.

