Figure 5.
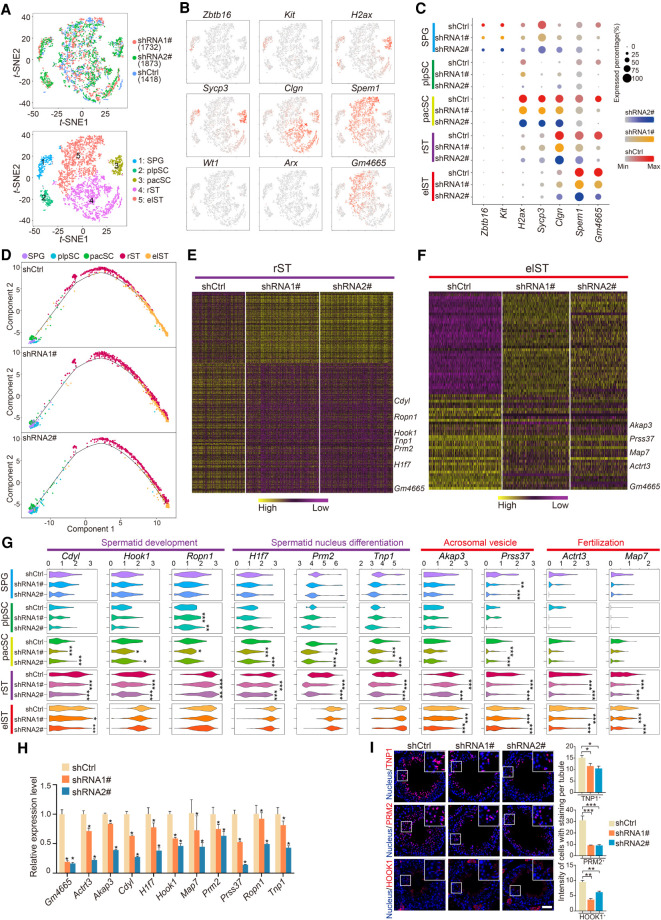
High-resolution dissection of transcriptional alterations induced by Gm4665 knockdown in testis. (A) t-SNE plots of all 5023 RFP+ germ cells. (Top) Cells colored based on differential treatment with shCtrl, shRNA1#, or shRNA2#; (bottom) cells colored by the identified cell populations with the labeled numbers indicating the individual clusters. (B) Expression patterns of marker genes exhibited on t-SNE plots. Cluster 1 was SPG; cluster 2 was plpSC; cluster 3 was pacSC; cluster 4 was rST; and cluster 5 was elST; Wt1 and Arx, somatic cell marker genes, served as negative controls. Red indicates high expression and gray indicates low or no expression. (C) Expression of marker genes and Gm4665 in cell populations from differentially treated shCtrl, shRNA1#, and shRNA2#. (D) Pseudotime analysis of Gm4665 control and knockdown male germ cells during spermatogenesis. (E,F) Heat map showing differentially expressed genes in rST and elST populations upon Gm4665 knockdown according to defined clusters 4 and 5. The color key from yellow to purple indicates high to low gene expression levels. Differentially expressed genes were identified between two groups of cells using a Wilcoxon rank-sum test. (G) Violin plot displaying expression level of representative functional spermatogenic genes upon Gm4665 knockdown in indicated cell populations. P-values were calculated using a Wilcoxon rank-sum test. (*) P < 0.05, (**) P < 0.01, (***) P < 0.001 compared with shCtrl. (H) Expression validation of differentially expressed genes in rST and elST populations by qRT-PCR. Data represent the mean ± SEM for three biological replicates. (*) P < 0.05 compared with shCtrl, Student's t-test. (I) Immunostaining of testis sections from the shCtrl, shRNA1#, and shRNA2# mice for TNP1, PRM2, and HOOK1 (red). Nuclei were stained with DAPI (blue). (Left) Representative images; (right) intensity of cells with staining per tubule. Data represent the mean ± SEM of at least 50 seminiferous tubules from three mice. (*) P < 0.05, (**) P < 0.01, (***) P < 0.001 compared with shCtrl, Student's t-test. Scale bar, 50 μm.

