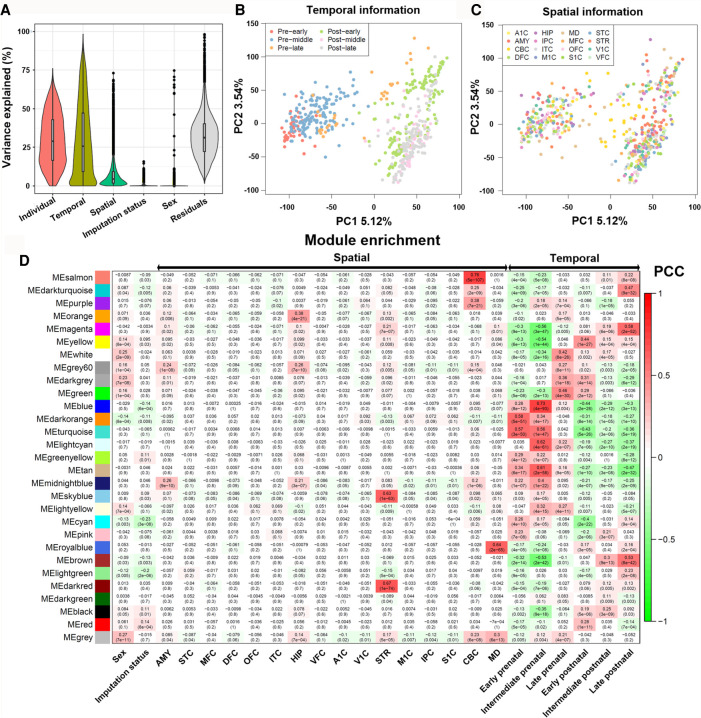
Figure 3.
Gene expression in BrainSpan is influenced by spatiotemporal factors. (A) Violin plots of the percentage of variance explained by each variable over all the genes. Principal component analysis (PCA) of gene expression data from BrainSpan, where samples are colored according to their temporal (B) and spatial (C) attributes. (D) Correlation between identified modules and spatiotemporal factor indicated by WGCNA.

