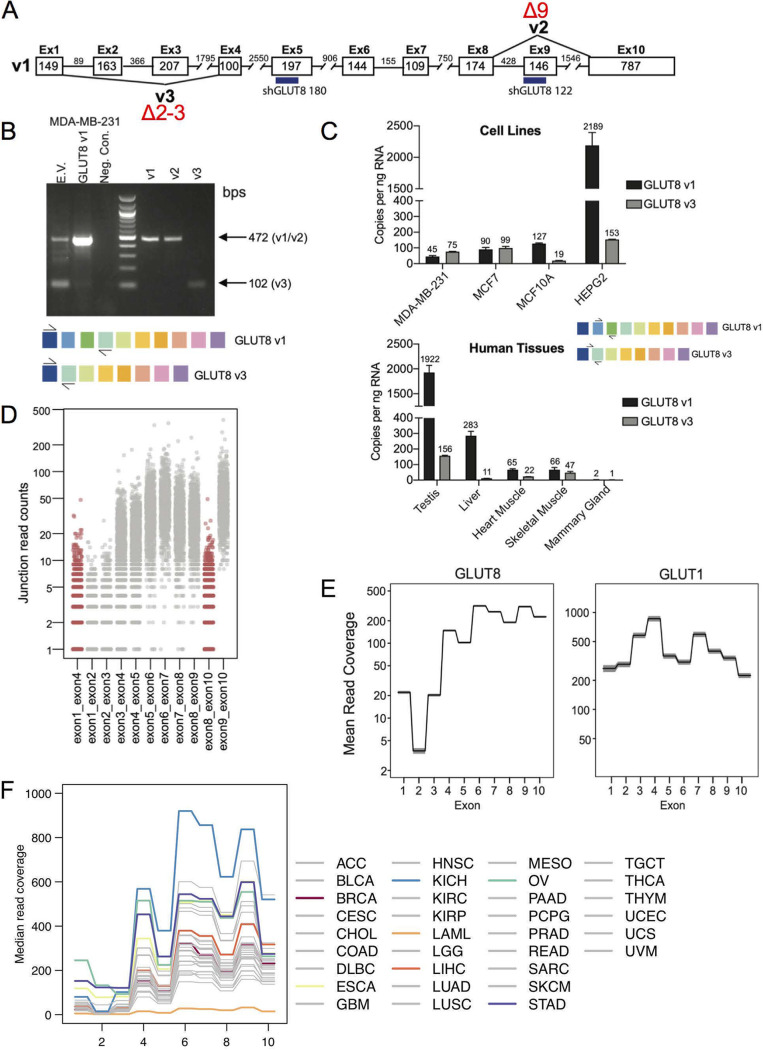
FIG 4.
Assay of alternatively spliced isoforms of GLUT8. (A) Schematic diagram showing the three alternatively spliced isoforms of GLUT8, v1, v2, and v3. The target sequences of two of the shRNAs used for data of Fig. 5 are indicated (numbers 122 and 180). (B) Assay of endogenous v1 and v3 expression in MB231 cells. Compare v1- and v3-derived bands from endogenously expressed GLUT8 species (empty vector; EV) with bands from cells transduced with an expression vector for GLUT1 (v1), derived from primers spanning exons 1 to 4 (creating products indicated in the schemes below). Controls (right side) show products from cells transduced with v1-, v2-, or v3-expressing plasmids. (C) Amount of v1- and v3-GLUT8 mRNAs in cells and tissues. RT-qPCR assay of GLUT8 v1 and v3 expression in human cancer cell lines and normal human tissue, determined using a standard curve of the target amplicon, with primers specific to v1 (exon 2-exon 3) or v3 (exon 1-exon 4; see scheme). (D) Splicing patterns in vivo. Exon-exon junction analysis of GLUT8 mRNAs from TCGA RNA-Seq data of breast tumors, showing the counts of v2 (exon 8-exon 10) and v3 (exon 1-exon 4) in red and canonical exon-exon junctions in gray. (E) Assay of relative exon expression. Analysis of mean read coverage for each exon from breast cancer TCGA RNA-Seq data set for GLUT8 and GLUT1. Shaded areas represent the 95% confidence interval (n = 1,091). (F) Analysis of GLUT8 exon frequency for a pan-cancer panel. Labels for each tumor type are excerpted from TCGA. Several tumor types are highlighted, for comparison with invasive breast carcinoma (BRCA), and discussed further in Results and Discussion (ESCA, esophageal carcinoma; KICH, kidney chromophobe; LAML, acute myeloid leukemia; LIHC, liver hepatocellular carcinoma; OV, ovarian serous cystadenocarcinoma: STAD, stomach adenocarcinoma).

