FIG 3.
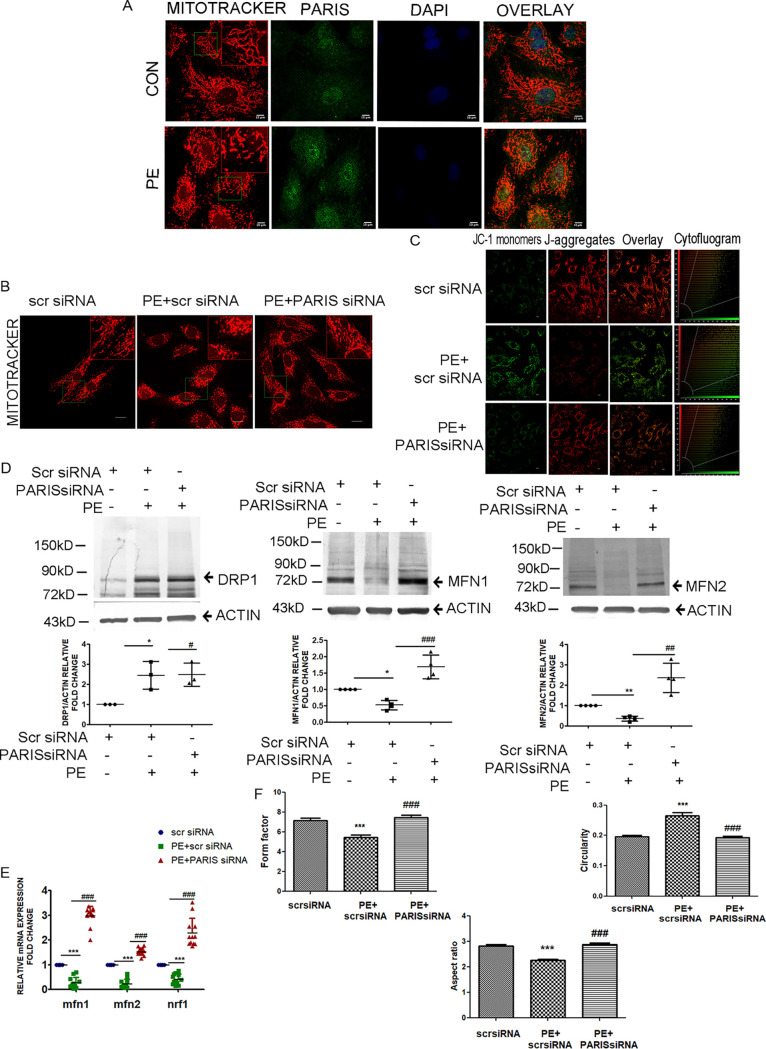
Regulation of mitochondrial dynamics by PARIS in hypertrophied myocytes. (A) Confocal micrographs showing fragmented mitochondria (red) and increased PARIS expression (green) in hypertrophied myocytes. DAPI was used to counterstain nuclei. Bars, 10 μm. n = 6 for each group. (Inset) Magnified view (×2) of the region marked by the green box. (B) MitoTracker red staining of cells transfected with either scrambled siRNA or PARIS siRNA in the presence or absence of PE treatment showing improved mitochondrial morphology in the PARIS siRNA-treated group. Bars, 20 μm. (Inset) Magnified view (×2) of the region marked by the green box. (C) Confocal micrograph of JC-1 staining displaying mitochondria with green fluorescence for compromised ΔΨm and red fluorescence for positive ΔΨm. Cytofluorogram demonstrating the red-to-green ratio in different treatment groups. Bars, 10 μm. (D) Immunoblot showing increased MFN1 and MFN2 expression with no significant change of DRP1 expression in PARIS siRNA treatment. Actin was used as an internal loading control. Graphical representation of immunoblot data showing the amount of change in expression of DRP1, MFN2, and MFN1 protein in PARIS knockdown hypertrophied myocytes. n = 3 or 4 for each group. *, P < 0.05, and **, P < 0.01 compared to controls. ##, P < 0.01, and ###, P < 0.001 compared to PE. (E) qRT-PCR showing significantly increased expression of Mfn1, Mfn2, and Nrf1 in PARIS siRNA treatment. Gapdh expression was used as the loading control. n = 12 for each group from 4 independent experiments. ***, P < 0.001 compared to controls; ###, P < 0.001 compared to PE treatment. (F) Assessment of mitochondrial morphology showing increased mitochondrial interconnectivity, represented by form factor, reduced circularity, and increased aspect ratio in the cells treated with PARIS siRNA compared to PE-treated group. n = 40 for each group from 3 independent experiments; ***, P < 0.001 compared to controls; ###, P < 0.001 compared to PE treatment.

