Figure 1.
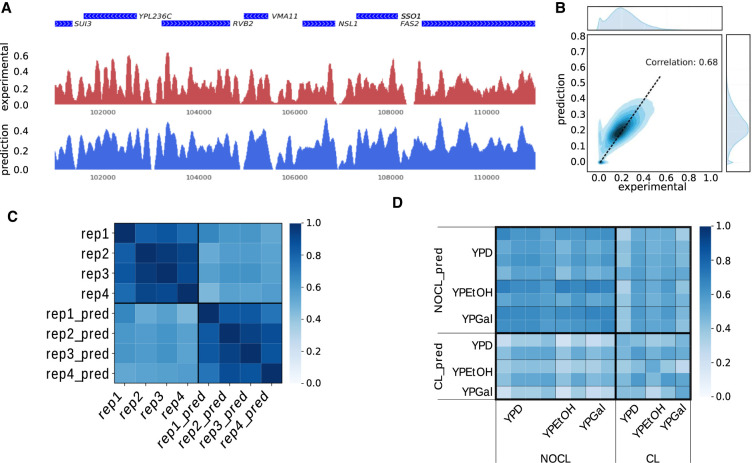
Evaluation of the predicted nucleosome density. (A) Comparison between experimental (red) and predicted (blue) nucleosome densities in a region of Chromosome 16. Genes are shown in blue on top of the two tracks (data from Hughes et al. 2012). (B) Density plot of the predicted nucleosome density in function of the experimental nucleosome density. The correlation between the two signals is 0.68. The distributions of the values of these two tracks on Chromosome 16 are also shown at the top (experimental) and on the right (prediction). (C) Cross-correlation between nucleosome densities on Chromosome 16 for four technical replicates (data from Kaplan et al. 2009) and four predictions obtained with models trained on each of the four replicates (e.g., rep1_pred is obtained with a model trained on the rep1 nucleosome density). (D) Cross-correlation between nucleosome densities for 13 experiments and 13 predictions with models trained on each of the 13 experimental densities (experimental densities are on the horizontal axis, predicted densities on the vertical axis). The 13 experiments were carried out using different growth media (namely YPD, YPEtOH, and YPGal). Two different cross-linking conditions were used (cross-linking of nucleosomes on DNA prior to MNase digestion: CL; or no cross-link: NOCL).

