Figure 4.
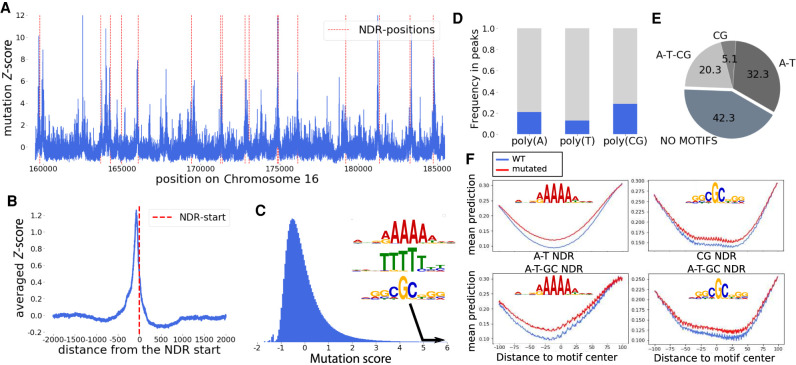
Effect of single mutations on the nucleosome density. (A) The mutation score on a region of Chromosome 16. NDRs are shown with red dotted lines. (B) Average of the mutation score aligned on all NDR starts. On average, the mutation score is peaking in the NDR, showing the major role of those regions in the nucleosome positioning process. (C) The distribution of the mutation score, as well as the three motifs enriched in the DNA sequences found in peaks with high mutation scores. (D) Proportion of poly(A), poly(T), and poly(CG) motifs in the genome that correspond with a high mutation score. (E) Proportion of four groups of NDR:NDR containing only poly(A/T) motifs (referred to as A-T), containing only poly(CG) like motifs (CG), containing both poly(A) and poly(CG) like motifs (A-T-CG), and NDR harboring none of these motifs. (F) Effect of a mutation in the poly(A/T) and poly(CG) motifs found in NDRs on the nucleosome density in A-T and CG NDRs, respectively (top), and in A-T-CG NDRs (bottom).

