Figure 5.
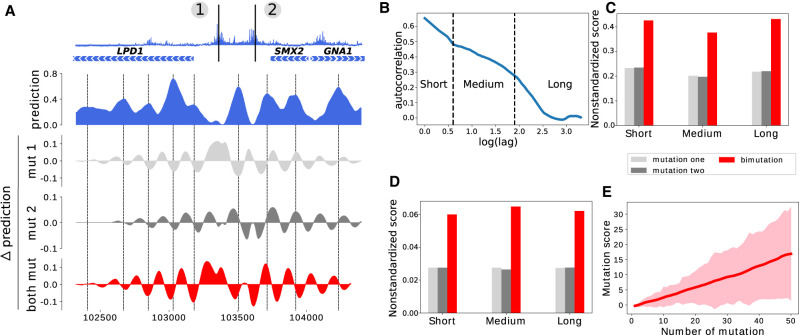
Effect of mutating multiple nucleotides. (A) Illustration of the effect of two mutations on nucleosome occupancy on a locus of Chromosome 16; (top) mutation score over the region, (blue) predicted nucleosome occupancy for the wild-type sequence, (light gray and gray) local variation of the prediction obtained when mutating position 1 or 2, respectively, (red) local variation of the prediction obtained when mutating both positions. Nucleosome occupancy peaks are highlighted with dashed lines. (B) Autocorrelation of the mutation score (semi-log-10 plot). Three different regimes can be identified, separated by dashed lines. (C) Average nonstandardized mutation score obtained by mutating 16,000 randomly sampled single nucleotides presenting a high mutation score (>5, light gray), by mutating, one by one, all nucleotides that are found closer than 500 bp to these mutations (gray), and by mutating all pairs of nucleotides that are closer than 500 bp (red). Mutation scores are separated in three categories based on the distance between the two mutated nucleotides: less than 5 bp (Short), between 5 bp and 90 bp (Medium), and between 90 bp and 500 bp (Long). (D) Same as C but for nucleotides with a low mutation score (<1). (E) Evolution of the mutation score with the number of mutations with a low mutation score. All mutations considered here—taken individually—have a score <1. The solid line represents the average mutation score, and the width of the line represents the standard deviation of the distribution of mutation scores.

