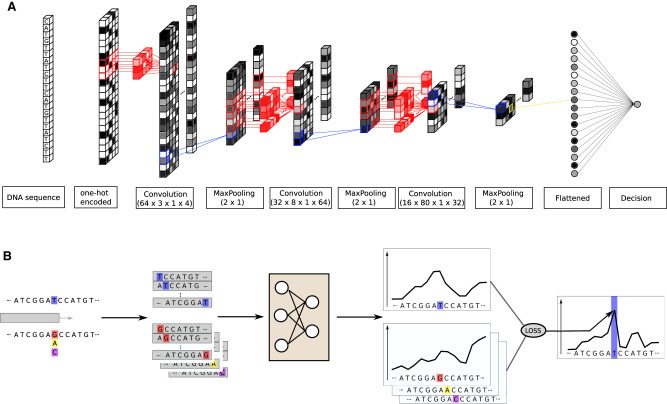
Figure 6.
CNN architecture and mutation score computation. (A) The model is trained to predict the nucleosome density at the center position of a 2001-bp-long DNA sequence. It contains three convolutional layers with max-pooling, batch-normalization, and dropout. The final convolutional layer output is flattened and fed to a single output neuron. (B) We test all the possible mutations at the position indicated in blue, here a T, and predict the nucleosome density around this position with and without mutations. The mutation score is the Z-normalized sum of the distance between the wild-type density and all the mutated type. The loss function used to train the network is used to compute the distance.

