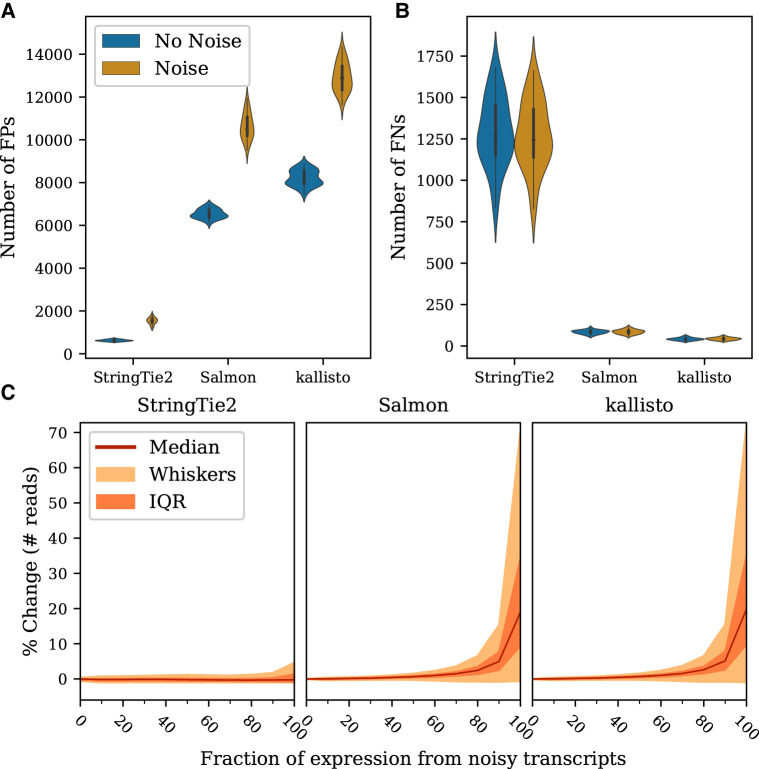
Figure 3.
Effects of noisy transcription on gene-level abundance estimation. (A) Distributions of the number of FP genes per sample, that is, the number of reported gene loci at which no actual transcripts were expressed. (B) Distributions of the number of FN genes per sample, that is, the number of gene loci for which the simulated data contained at least one expressed transcript but where the program failed to report any. (C) Percentage of change in the number of reads assigned to a gene as a function of the fraction of expression at that locus that comes from unannotated transcripts. Percentage of change was computed relative to the total number of reads simulated for all annotated transcripts at each locus. Only loci with more than zero reads from annotated transcripts are shown.

