Figure 6.

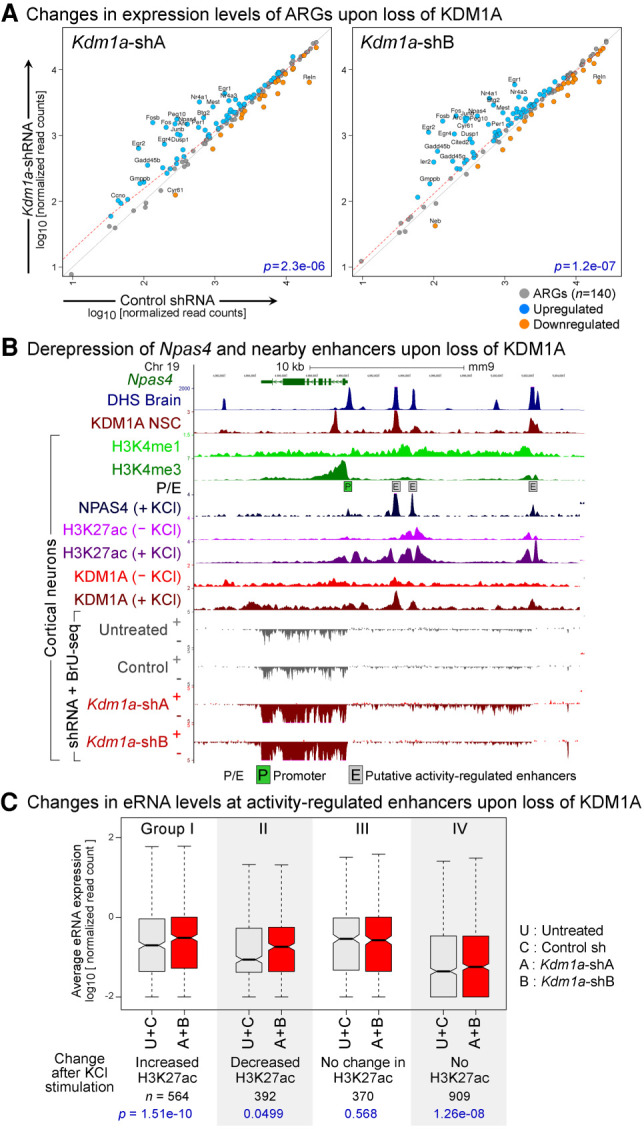
KDM1A represses inducible genes and enhancers in terminally differentiated neurons. (A) Up-regulation of activity-regulated genes (ARGs) in Kdm1a-KD cortical neurons. Scatterplots of transcription levels of ARGs (n = 140) from BrU-seq analysis in CN treated with either Kdm1a shRNAs (y-axis) or control shRNA (x-axis). Significantly up-regulated (q < 0.05, DESeq) and down-regulated ARGs are shown in blue and orange, respectively, and ARGs with greater than a twofold difference with KDM1A loss are labeled with gene symbols. P-values (p) from Wilcoxon signed-rank tests are denoted in blue. (B) Aberrant induction of Npas4, an ARG, upon Kdm1a-KD in resting CN. Boxed P: Npas4 promoter, boxed E: putative activity-regulated enhancers as evident from the presence of DHS (Neph et al. 2012), high H3K4me1, low H3K4me3 (Iwase et al. 2016), activity-dependent binding of NPAS4, and an increase in H3K27ac after KCl treatment (Malik et al. 2014). Npas4 mRNA and eRNA are up-regulated in the Kdm1a-KD neurons (red). KDM1A ChIP-seq data were obtained from previous studies using neuronal stem cells (NSC) (Wang et al. 2016) and CN (Wang et al. 2015). (C) Increased eRNA levels at activity-regulated enhancers in Kdm1a-KD CN. These enhancers were divided into four groups based on the activity-induced changes in H3K27ac (Malik et al. 2014). Three groups of enhancers show a significant increase in eRNA levels upon Kdm1a-KD (red boxes) compared with control conditions (untreated CN or control shRNA-treated CN, gray boxes). (A + B) Geometric mean of eRNA levels in CN treated with Kdm1a shRNAs A or B, (U + C) geometric mean of eRNA levels in control neurons. P-values (p) from Wilcoxon signed-rank tests are denoted in blue.
