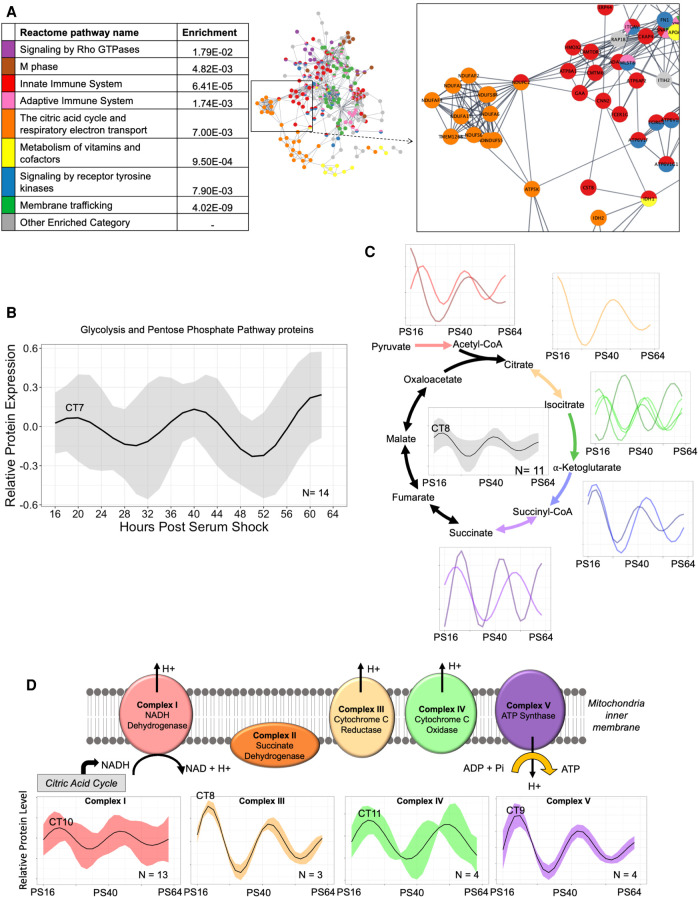
Figure 4.
Circadian regulation of central metabolic pathways coordinates mitochondrial ATP synthesis in the early phase. (A) A global view of the STRINGdb network of the proteins in enriched Reactome categories that peak in the early wave (CT3–15), with an inset focusing on key interactions, including the citric acid cycle and respiratory electron transport. Interactions shown as strings are filtered to highest confidence interactions (confidence > 0.9). Colors denote independent Reactome categories. Gray coloring represents genes from enriched Reactome categories that did not represent a significant proportion of the protein–protein interactome or described redundant categories. (B) An average of the oscillations for circadian proteins in the glycolysis and pentose phosphate pathways (PPPs). The average relative protein abundance model of all circadian proteins identified in each phase is represented, with the shaded region representing the standard deviation between models at each time point. The circadian time of the first peak is labeled. (C) A schematic of the subunits involved in the TCA cycle which had component proteins identified as rhythmic. An average curve and shaded standard deviation of the overall TCA cycle (center) as well as individual modeled fits for all circadian proteins in the identified corresponding enzyme complex are shown next to each step. The circadian time of the first peak is labeled. (D) A schematic of the subunits involved in the ETC which had component proteins identified as rhythmic. Average curve and shaded standard deviation of the modeled fits for all circadian proteins in the identified enzyme complex are shown below. The circadian time of the first peak is labeled.

