Figure 6.
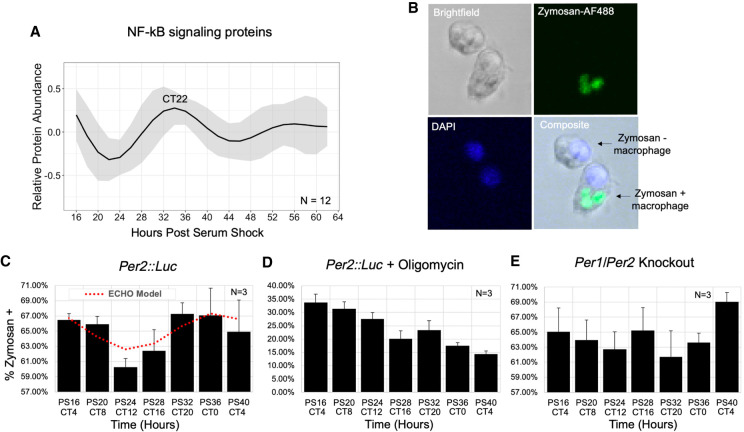
Macrophage phagocytosis of zymosan shows metabolism-related circadian variation in vitro. (A) An average of the modeled fits of all 12 circadian proteins in the NF-kB signaling pathway. The circadian time of the first peak is labeled. (B) Representative confocal microscopy images demonstrating identification of macrophages positive and negative for phagocytosis of zymosan-AlexaFluor488. Cells were also DAPI-stained to aid in cell counting. The levels of phagocytosis are reported as a percent of cells with one or more particles of zymosan in (C) Per2::Luc, (D) Per2::Luc co-incubated with oligomycin, and (E) Per1/Per2 knockout BMDMs at a 4-h resolution for 24 h (N = 3). Trace of significant circadian oscillation as determined by ECHO (BH adj P-value = 0.0026) is plotted on the Per2::Luc graph in a dotted red line. Error bars represent standard error of the mean (SEM) for triplicate samples. All parameters for ECHO and JTK analyses, including noncircadian oscillatory fits for D and E, are reported in Supplemental Table S5.

