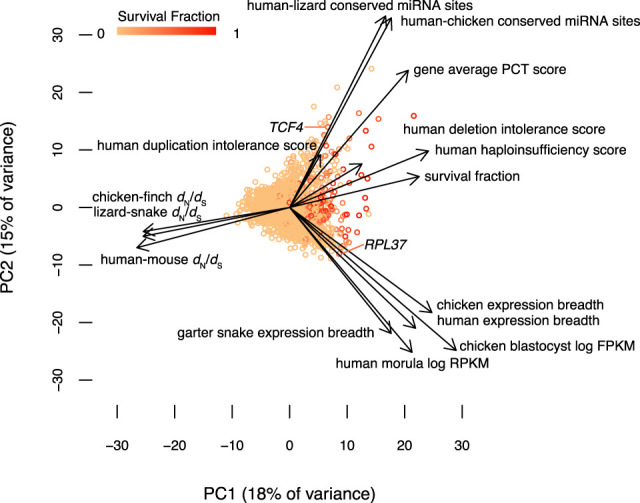
Figure 5.

Dosage sensitivity and broad expression make independent contributions to survival. A statistical summary of survival factors from 2564 genes based on principal component axis one (PC1) and axis two (PC2). Points represent individual genes, colored by their survival fraction from orange (no survival) to red (survival in all possible lineages) (Methods; Supplemental Table S7). Arrows show the contribution of each factor to the variation in survival of ancestral genes on sex-specific chromosomes. Dosage sensitivity and breadth of expression make roughly orthogonal contributions, whereas strength of purifying selection is closely aligned with survival.
