Figure 1.
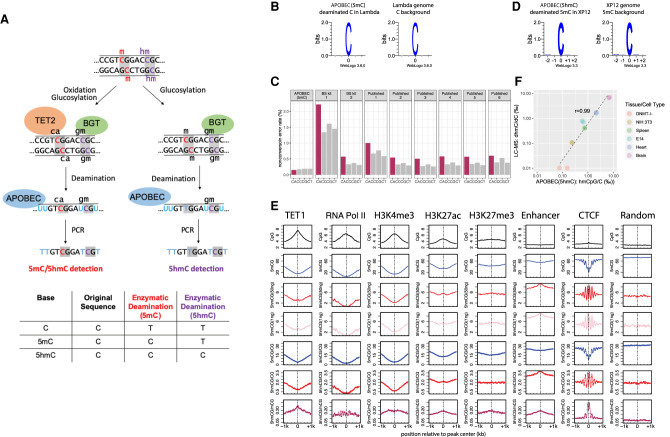
5mC and 5hmC detection by enzymatic deamination method. (A) Principle of the methodology: genomic DNA can either be treated with TET2 and BGT (left) to protect both 5mC and 5hmC or with BGT alone (right) to protect 5hmC. Subsequent deamination by APOBEC3A followed by PCR amplification allows the distinction between the unprotected substrate (read as T) from the protected cytosine derivatives (read as C). The TET2 and BGT treatment results in the distinction of 5mC and 5hmC from C, whereas BGT treatment results in the distinction of 5hmC from C and 5mC. (B) Deaminated cytosines from unmethylated lambda genome display no observable sequence preference by APOBEC(5mC) deamination method. (C) False-positive methylation calling rate (nonconversion error rate) of each cytosine dinucleotides sequence context (CpA [CA], CpC [CC], CpG [CG], and CpT [CT]) estimated from the unmethylated lambda genome for the enzymatic deamination method (APOBEC(5mC), two WGBS performed in this study, i.e., BS kit 1 and BS kit 2, and six published WGBS experiments sampled from the ENCODE Project) (Supplemental Table S3). (D) Deamination of 5mC in the fully methylated XP12 genome results in no observable sequence preference by APOBEC(5hmC) enzymatic deamination method. (E) Distribution patterns of 5mCpG (blue) and 5hmCpG (red: 50 ng library; pink: 1 ng library) at various protein/DNA interaction sites. The absolute (smooth lines) and normalized (dotted lines) 5hmC and 5mC levels in the CpG context are depicted around TET1, RNA polymerase II, and CTCF binding sites, as well as at active transcription chromatin mark (H3K4me3), repressive chromatin mark (H3K27me3), active enhancer mark (H3K27ac), and general enhancer (H3K4me1 in the absence of H3K4me3) regions. Unbound sites that are randomly sampled from the reference genome server as a control. (F) Pearson's correlation between 5hmC measured using sequencing of enzymatically deaminated DNA (x-axis) versus LC-MS (y-axis) for various genomic DNA. There are two technical replicates of the APOBEC(5hmC) sequencing method for each sample. 5hmC levels are presented as 1000 percentage, and both axes use the log scale.

