Figure 2.
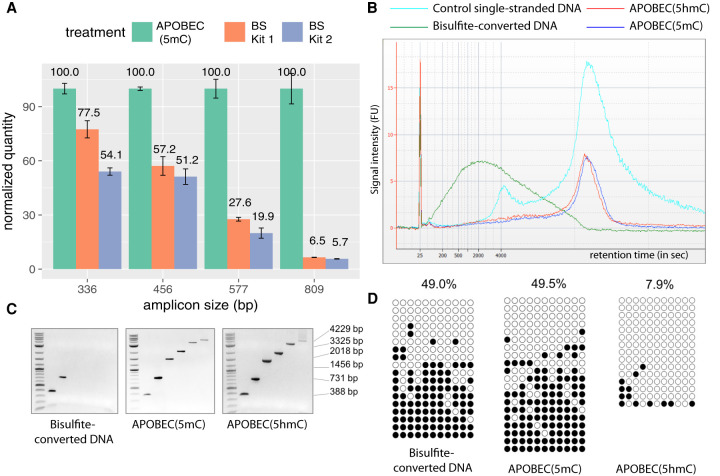
Enzymatic deamination preserves the integrity of the DNA. (A) qPCR results show the quantities of undamaged amplifiable DNA templates of different sizes after the enzymatic deamination (green) and bisulfite treatments (orange and blue). All quantifications are normalized to the values obtained for the enzymatic deamination experiments. (B) Agilent 2100 Bioanalyzer trace on RNA 6000 pico chip comparing equal amounts of mouse E14 genomic DNA sheared to an average of 15 kb and treated with sodium bisulfite (green), APOBEC(5hmC) (red), or APOBEC(5mC) (blue) over the control ssDNA (cyan). Bisulfite treatment fragmented the DNA to an average of 800 bp, whereas enzymatically treated DNA shows no notable size differences compared with control DNA. (C) Agarose gel images of end-point PCR of six amplicons ranging from 388–4229 bp illustrating upper amplicon size limit for sodium-bisulfite-, APOBEC(5mC)-, or APOBEC(5hmC)-treated E14 genomic DNA. (D) The 731-bp amplicons from the E14 genomic DNA shown in C were cloned and sequenced, and the methylation status was determined by bisulfite treatment (left), the enzymatic deamination method for 5mC (center), and the enzymatic deamination method for 5hmC (right) (Supplemental Data S1). Open and closed circles indicate unmethylated and methylated CpG sites, respectively.

