Figure 3.
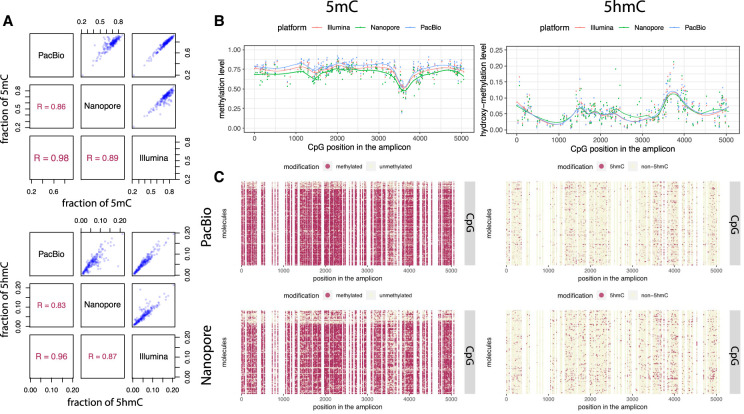
5mC and 5hmC phasing using long-read sequencing. (A) Scatter plots and Pearson's correlations of calculated methylation (top) and hydroxymethylation (bottom) levels of all CpG sites within the 5378-bp region from the mouse E14 genome between the three sequencing platforms: PacBio, Nanopore, and Illumina. (B) Dot plots showing methylation (left) and hydroxymethylation (right) levels of individual CpG sites within the 5378-bp region calculated by the LR-EM-seq method using three major sequencing platforms: Illumina (red), Nanopore (green), and PacBio (blue). The fitted lines are drawn using the LOESS method. (C) Single-base single-molecule cytosine modification maps of the 5378-bp region generated by the LR-EM-seq method coupled with PacBio SMRT sequencing (top) and Nanopore sequencing (bottom). Methylated (left) and hydroxymethylated CpG sites are depicted by red dots, and unmodified CpG sites are depicted by beige dots.

