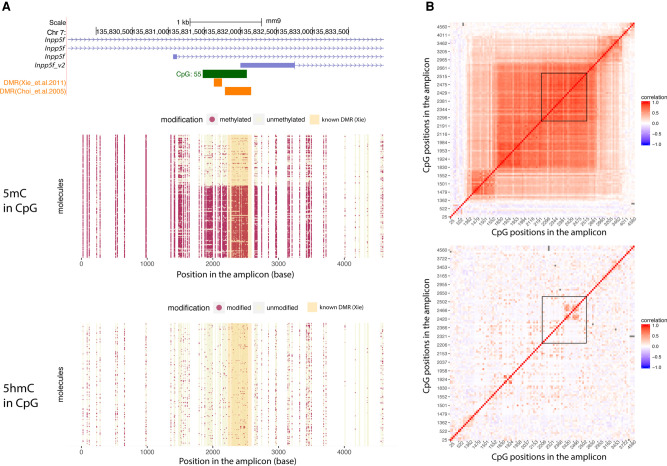
Figure 4.
Phasing of 5mC and 5hmC by LR-EM-seq. (A) Single-base, single-molecule CpG methylation (middle) and hydroxymethylation (bottom) profile of a 4.6-kb region of the imprinted Inpp5f_v2 gene locus (top) in the mouse brain. Red dots represent modified sites, and beige dots represent unmodified sites. This region overlaps with the promoter for the Inpp5f_v2 gene and contains a previously reported DMR (orange box). The shaded area in the dot plots corresponds to the known DMR. (B) Correlation matrix of CpG modification state: (top) 5mC; (bottom) 5hmC. Each location on the matrix represents the correlation of any two CpG sites across the amplicon and the correlation strength is depicted by color: red indicates correlation=1; blue, correlation=−1; white, no correlation. The known DMR is indicated by a black outline.

