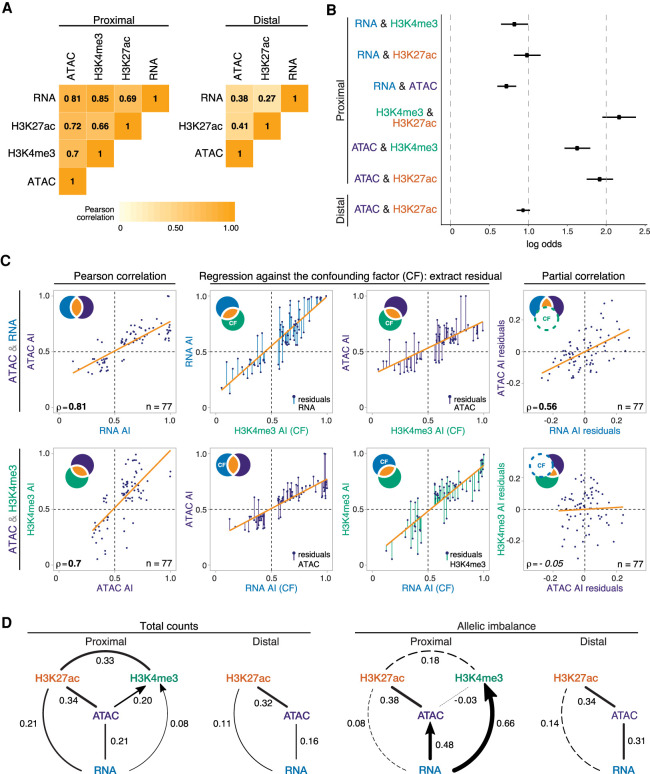
Figure 4.
AI is propagated through regulatory layers via different epigenetic paths. (A) Heatmaps show Pearson correlation coefficient of allelic ratios between each data type for promoter-proximal (left) and promoter-distal (right) regions. Data restricted to 6–8 h and 10–12 h and features/genes whose allelic ratio exceeds 0.5 ± 0.06. (B) Log odds (intersection-union test) of co-occurrence of AI between two regulatory layers: 6- to 8-h and 10- to 12-h data shown; bars (from dots), 95% confidence intervals. (C) Stepwise example of partial correlation analysis of allelic ratios between chromatin accessibility and gene expression (ATAC&RNA; top), and promoter-proximal chromatin accessibility and H3K4me3 (ATAC&H3K4me3; bottom). Venn diagram schematics (top left) illustrate the variance of each variable and its shared proportion (orange), measured by linear regression (orange lines). (Left panels) Pearson's correlations for the two comparisons are significant. (Middle) Regression of each initial variable against a third, confounding variable (H3K4me3, upper row; RNA, lower row). Residuals of the initial variables (colored lines) represent the nonoverlapping part of the circle of the same color in the schematic. (Right) Correlations of the residuals, excluding shared variance by the confounding factor (dashed circle in schematic). This resulting partial correlation is significant in the top, and not in the bottom, examples. (D) Partial correlation and directional dependency regression for total counts (left) and allelic ratios (right). Significant partial correlations (solid lines) suggest direct dependencies among regulatory layers. For each significant edge (P < 0.01), copula regression was used to assign directionality (arrows; delta > 0.01). Line thickness indicates the value of partial correlations; dashed lines indicate nonsignificance. Promoter-proximal and promoter-distal results shown separately.

