Figure 6.
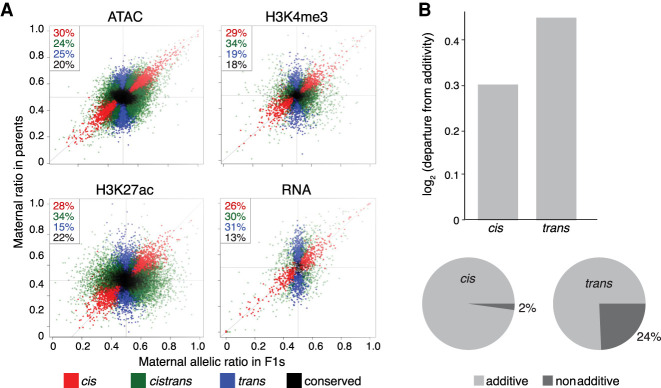
Chromatin features are more heritable than gene expression. (A) Scatter plots of F1 allelic ratio (x-axis) against the maternal/paternal ratio observed in (normalized) parental, total count libraries (y-axis). Genes/features along the diagonal are exclusively influenced by cis-acting variation, whereas vertically distributed genes/features show exclusively trans influences. Colors indicate maximum likelihood classification into cis, trans, and cistrans (a mixture of cis and trans) or conserved genes/features. (B, top) Bar plots showing the magnitude of deviation from additivity (parental mean) for cis versus trans (BIC ≥ 2) features. (Bottom) Pie charts showing fraction of additive and nonadditive genes for cis (left) and trans (right) classes.

